Hello and welcome to another edition of the bulls vs the bears. Today we are going to learn four sure ways of trading forex sideways. Now I can hear someone pulling his hair out saying” This guy is giving us mental whiplash today.” Don’t sweat this one. This is my own short hand way of showing you four tips for trading sideway markets. Let’s face it guys, you are not always going to enjoy sustained trends on the forex marjet- be it uptrend or downtrend. There comes a time when the markets are moving sideways. In other words, they are neither trending upwards nor downwards. This is where rookie traders fall victim to these skittish patterns. They end up up losing all their profits to these whiplash setups and then turn around and curse the market for their losses.
However, there is an interesting twist to this tale. Not all sideways markets are as crazy as you think. Some can be traded while others you just leave them alone if you value your sanity. Hopefully by the end of today’s lesson you would have acquired valuable knowledge as to how to make critical decisions when the market switches from a strong trending pattern to to a swerving whiplash situation. So Onward
First Tip
Is The Market Worh Trading Or Not?
The first question you need to ask yourself is “Is the market worth trading or not? If the market is not swinging between defined support and resistance areas, with good distance between both levels, don don’t even think about putting in a trade. Your account will become barbecued chicken.
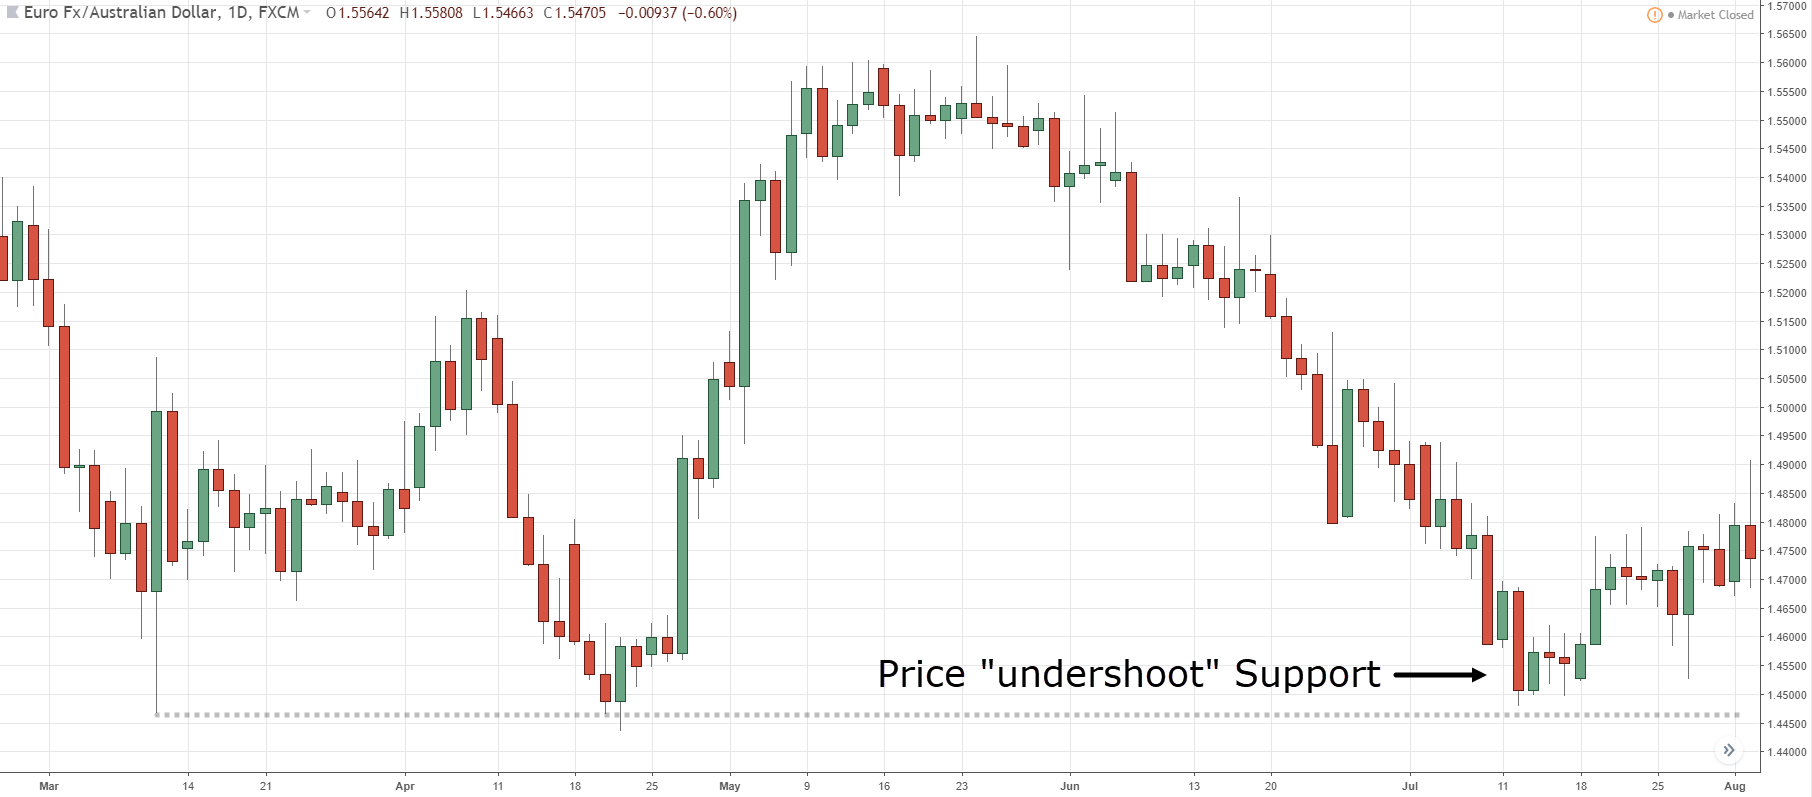
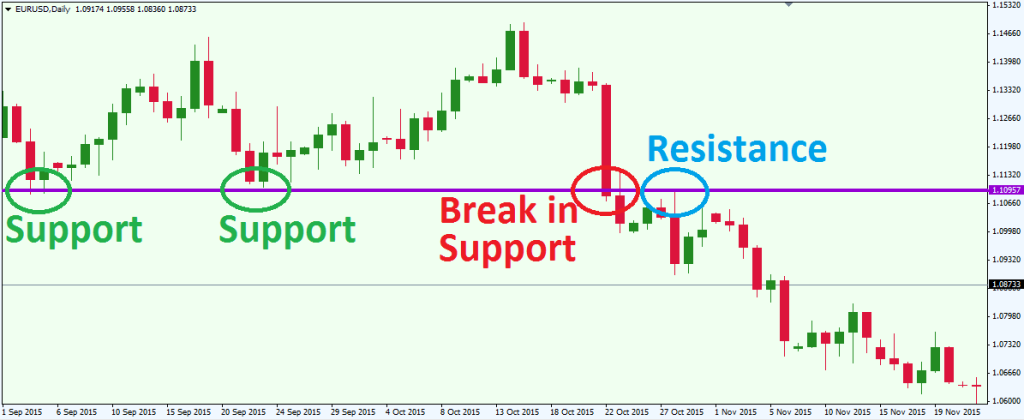
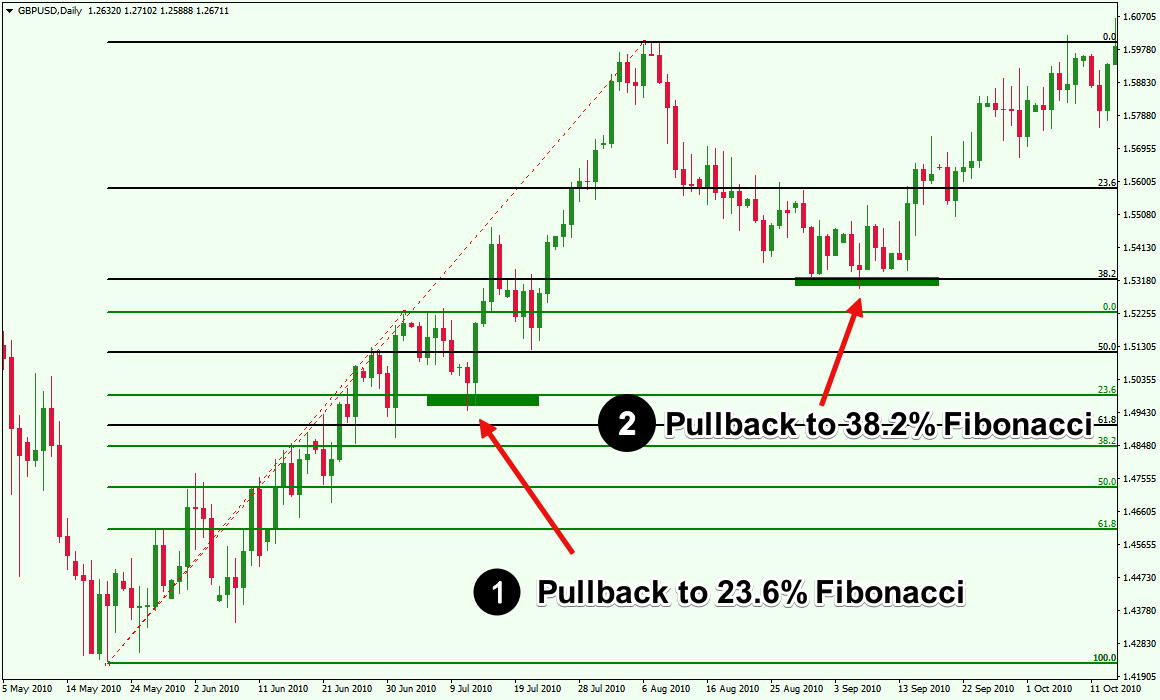
I can hear someone asking”Well how do I know whether a market is worth trading or not?” Well you can start by zooming in on the daily chart frame. Now the question you need to ask yourself when looking at the daily chart frame is ” IS the market trending up or down?” If it’s not doing either, the market is moving sideways. Let me show show what sideway markets that are range-bound look like

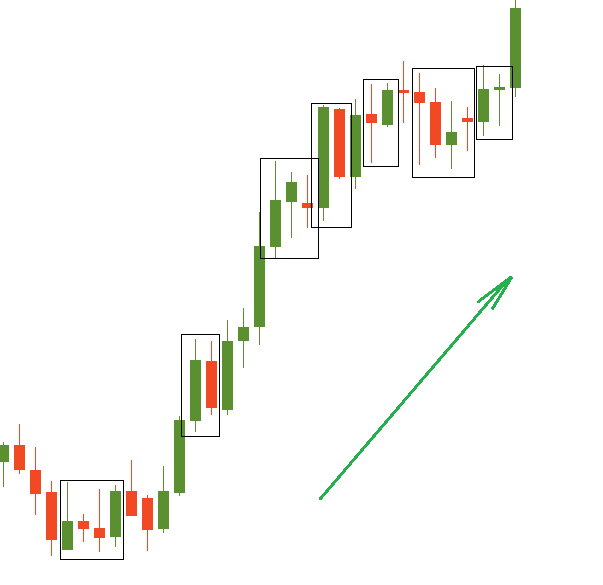
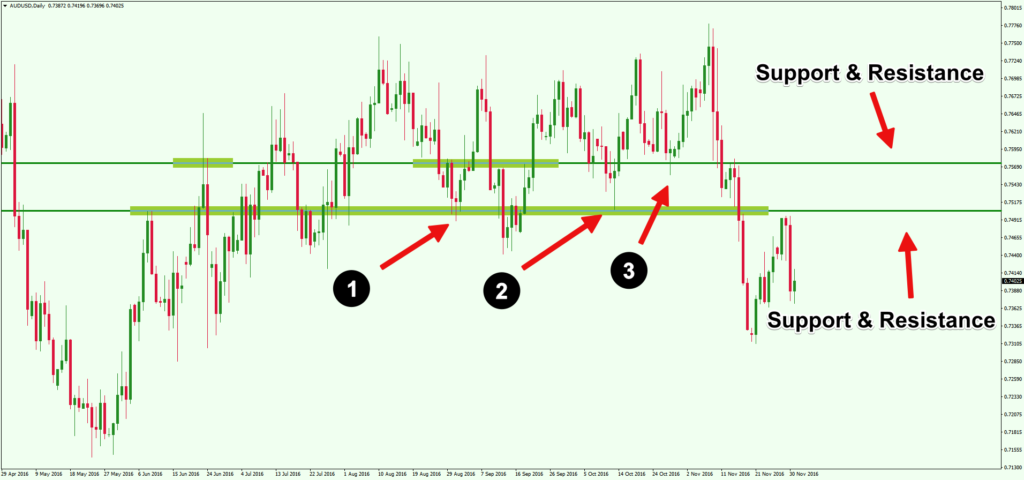
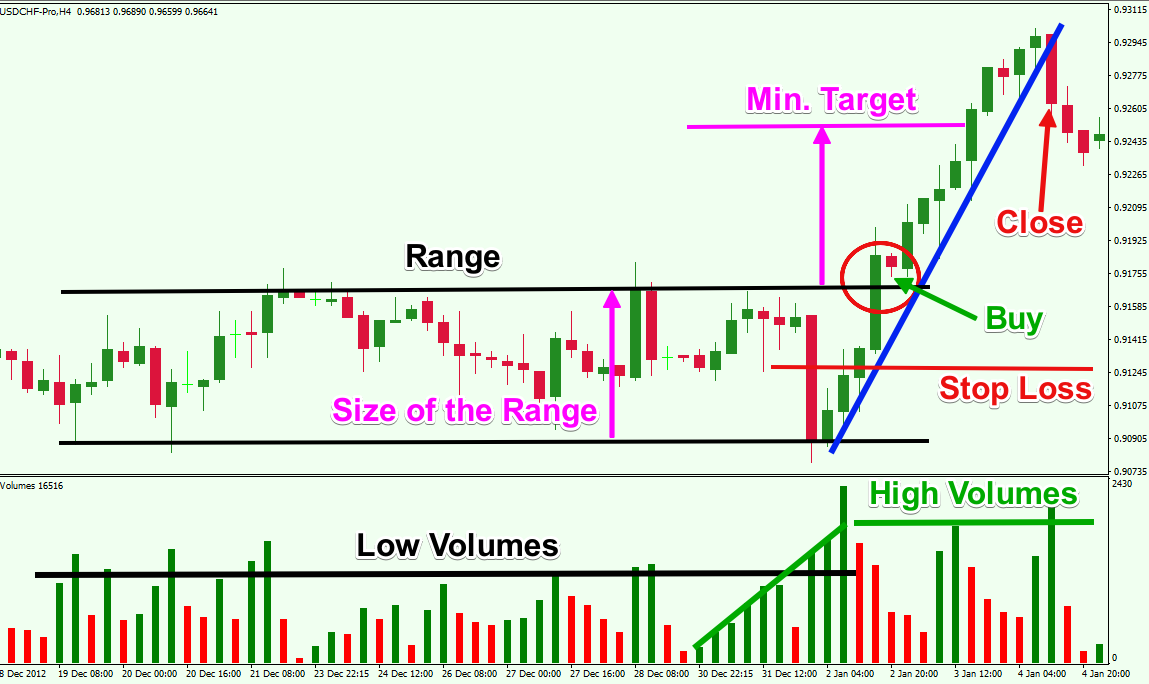
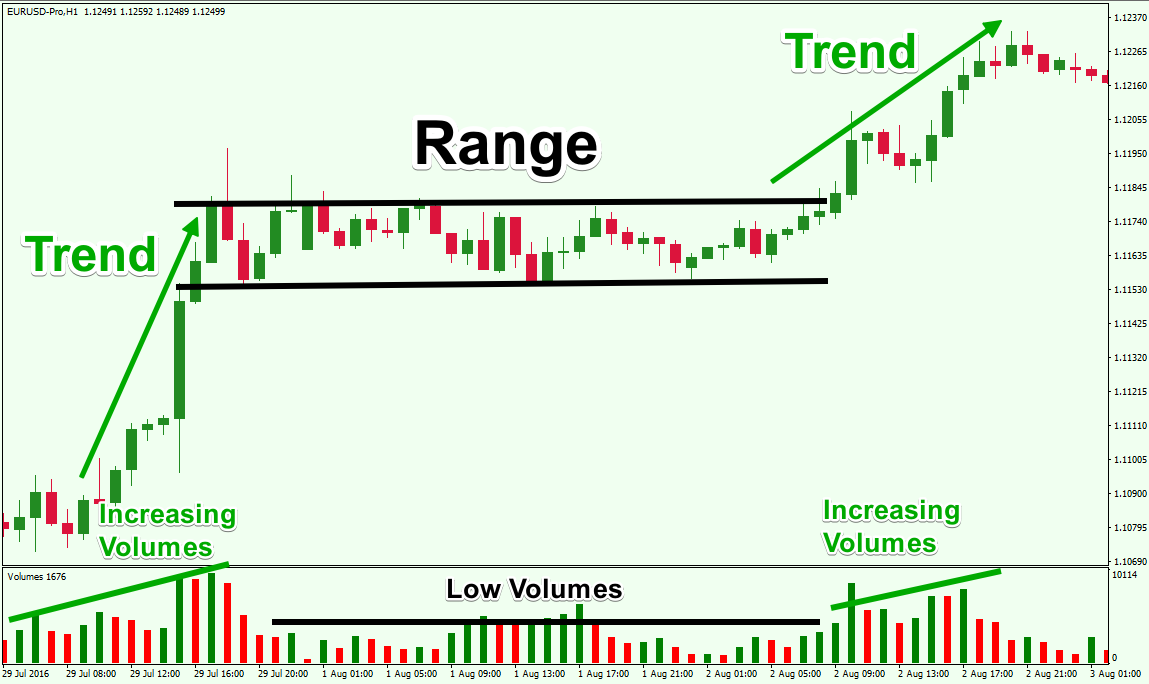
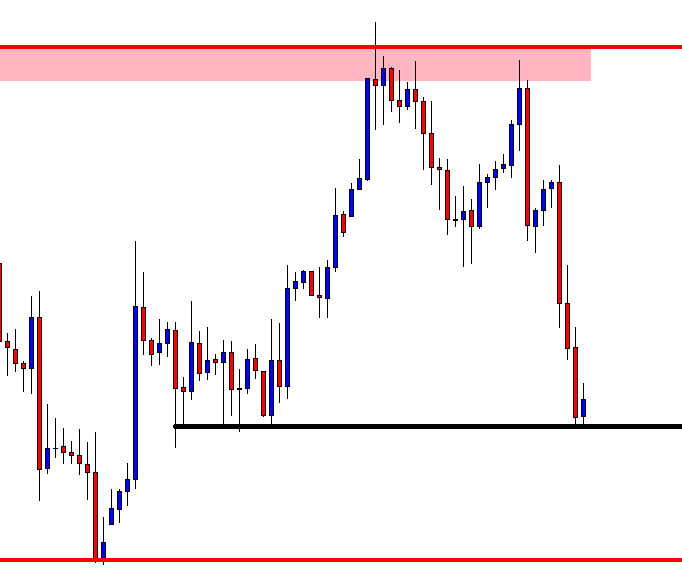
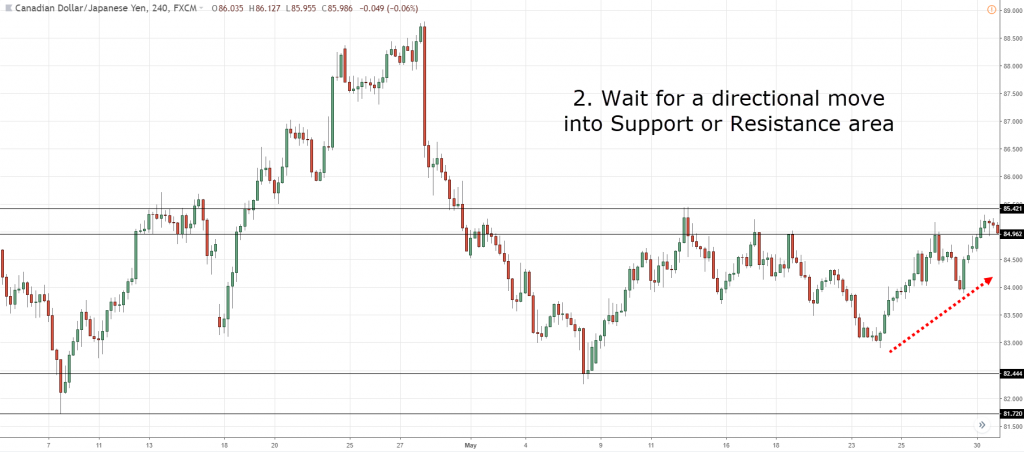
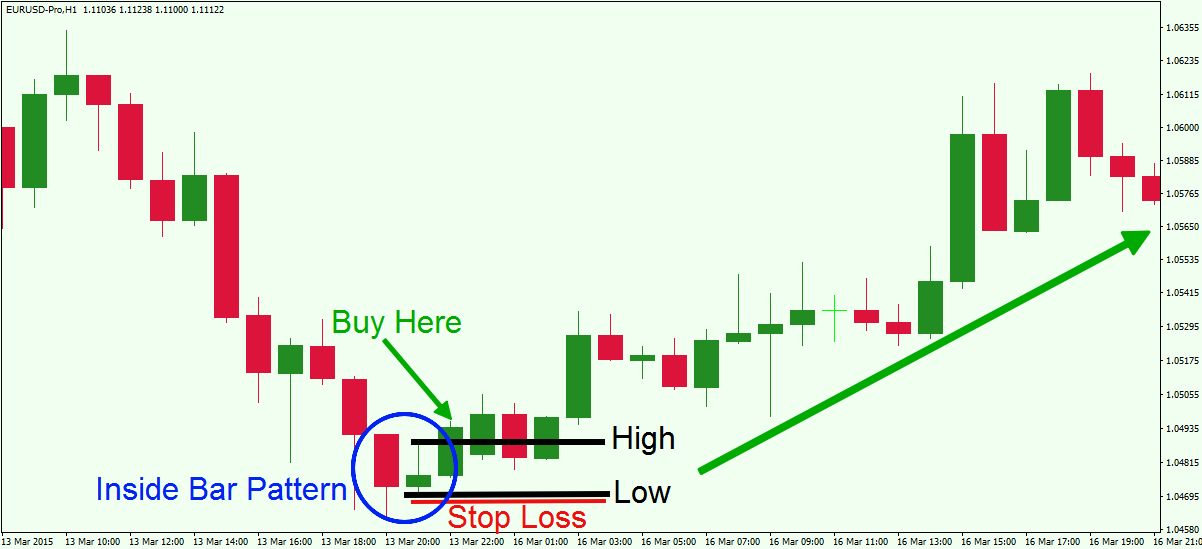
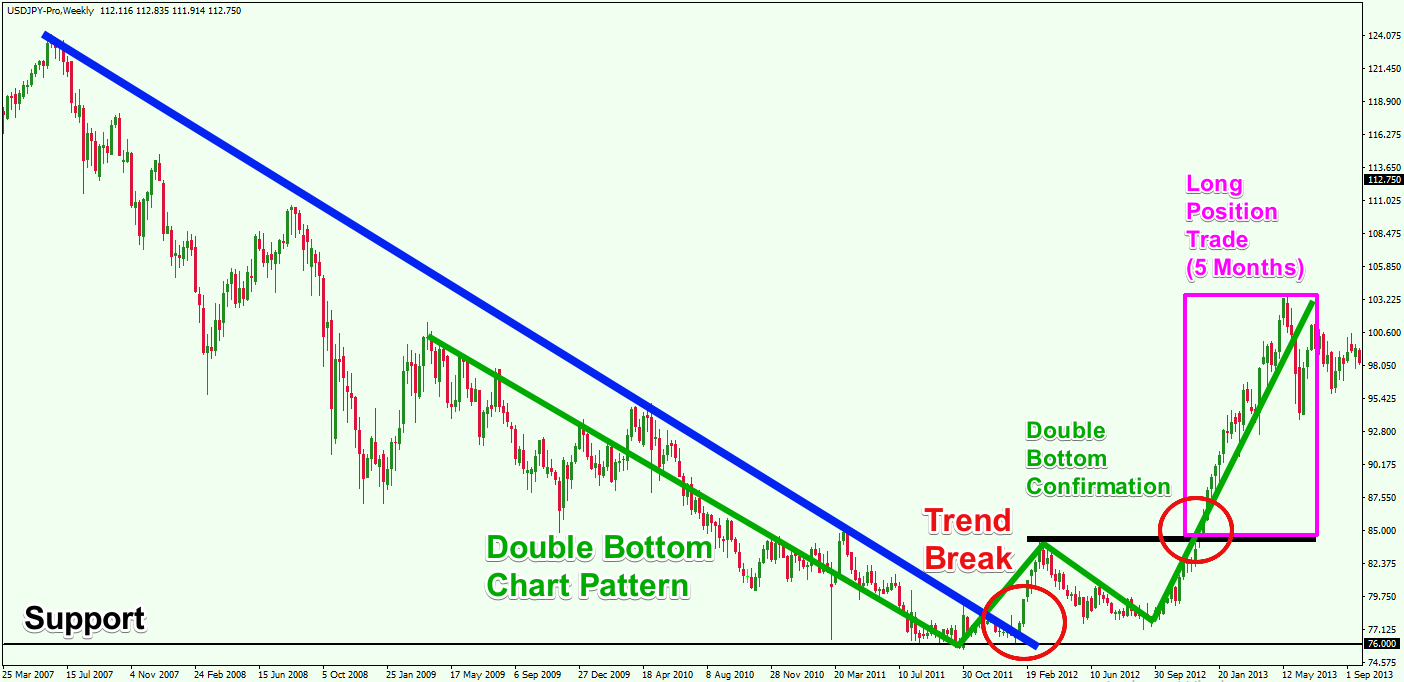
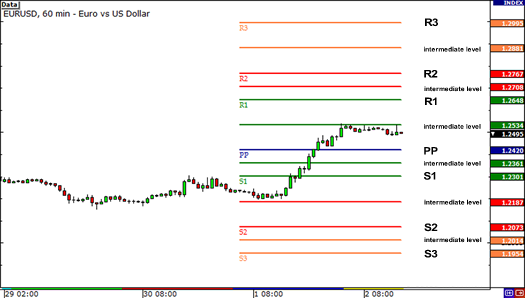
Ladies and gentlemen this is what a range-bound looks like. See the distance between the support and the resistance levels of the range. Even more important these levels are well defined. This gives you the trader something to work with when looking for solid price signals and great risk/reward potential. You do all this hoping that price will move to the other end of the range, or at least inch closer to it.
If The Waters Are Choppy Dont Trade
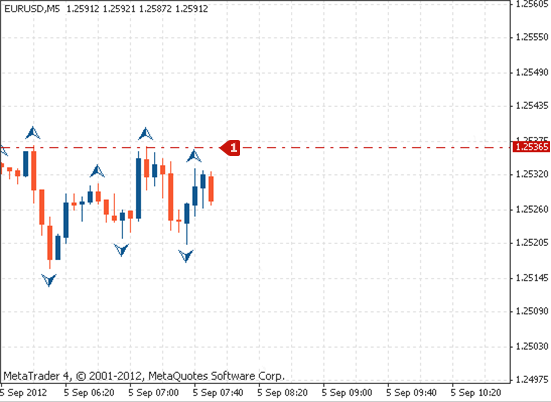
It’s simple advice . Isn’t it? If the waters on the forex market are choppy don;t bother trading. Because if you take a dip in those waters the sharks will eat you up. Somebody is scratching his head wondering”What;s a choppy market?” Well a choppy market is one that consolidates so tightly. In fact it consolidates so tightly it’s as if a noose is hanging around the neck of the major traders. When you see a market like that it’s not worth risking your market in because the distance between reversals is not big enough to allow for a risk/reward ratio.
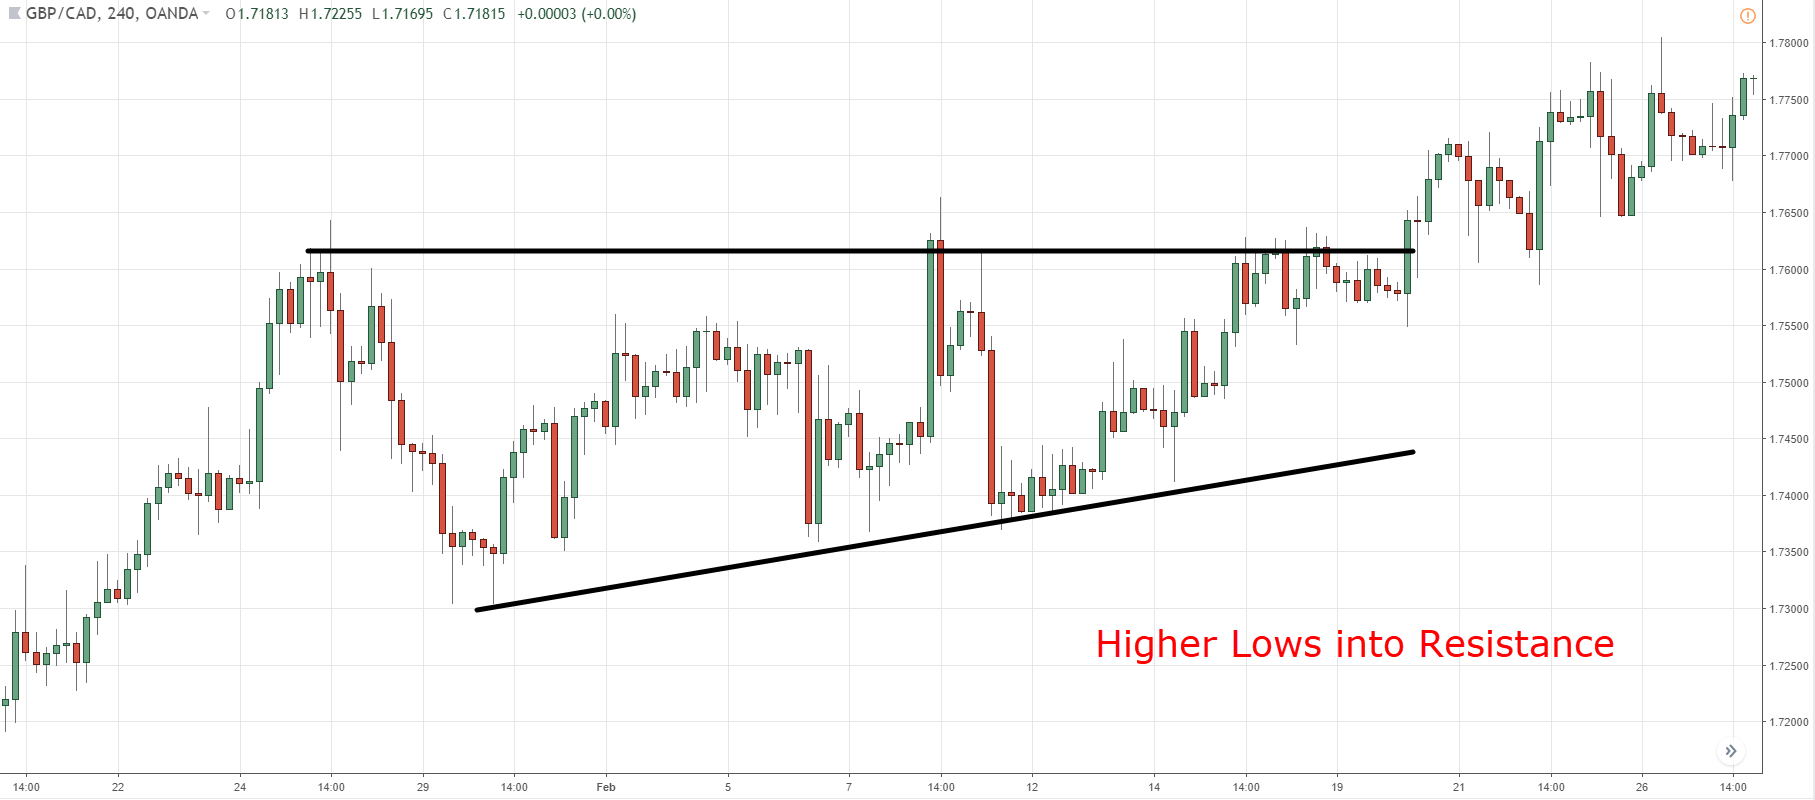
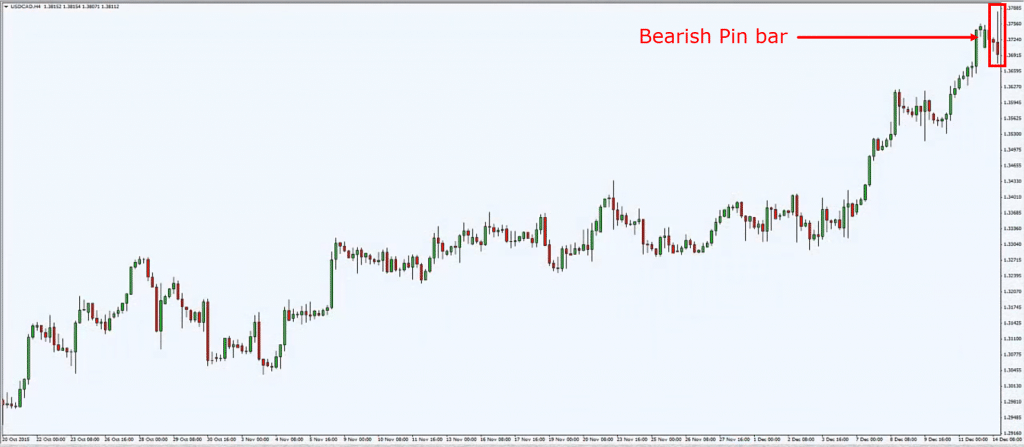
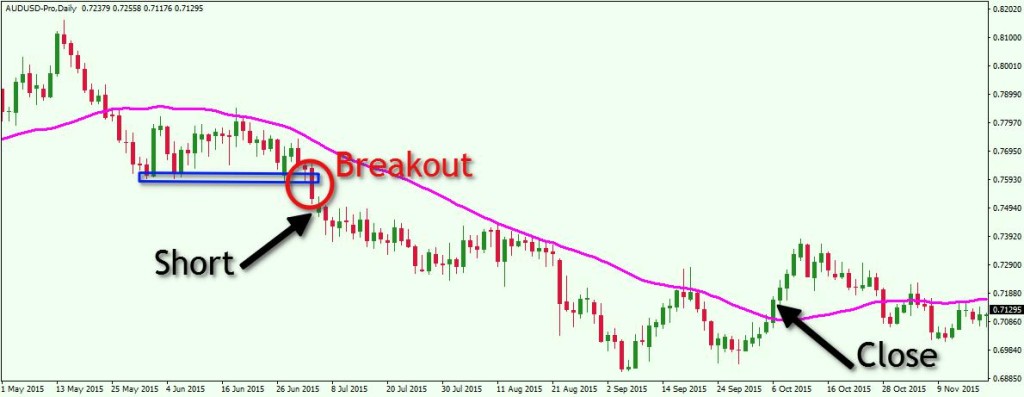
The next question I hear somebody asking is “How Do I know if the market is choppy?” Like I indicated earlier zoom in the daily chart frame. With lots of practice and experience, you should be able to tell whether the market is range-bound or shark -infested(choppy). Let’s take a good look at a good example of of a shark-infested choppy market
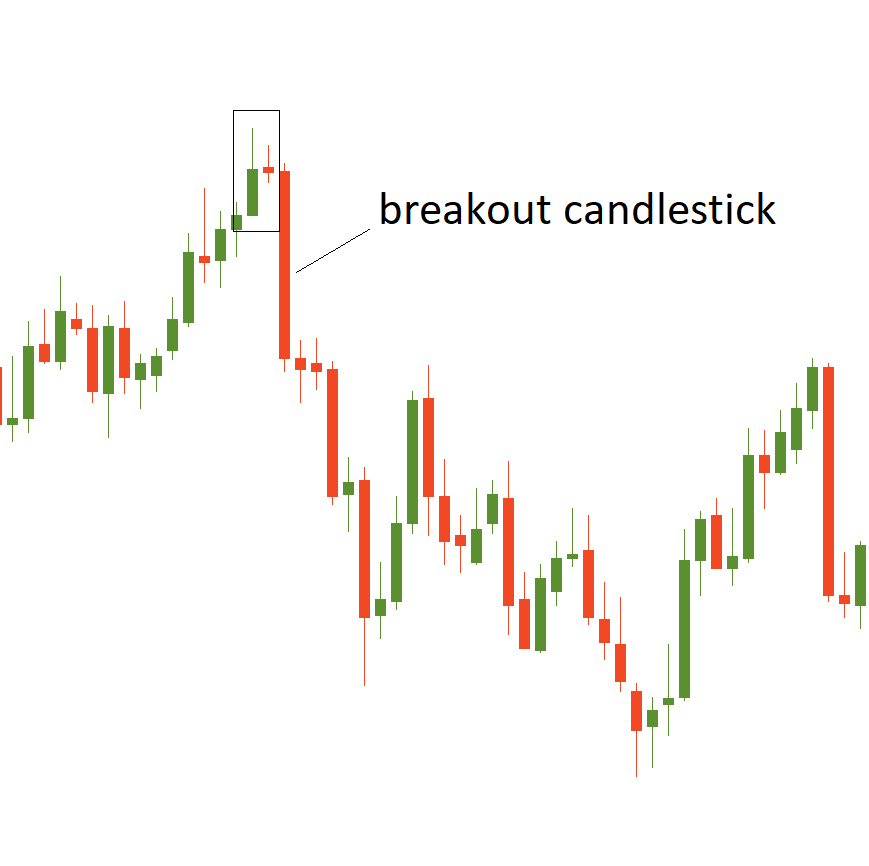
See how choppy and tight the price action is in the area with the sloping blue line. Any time you see setup like this, it can only mean one thing. The sharks are around looking for prey to devour. Put in a trade and you could become shark bait.
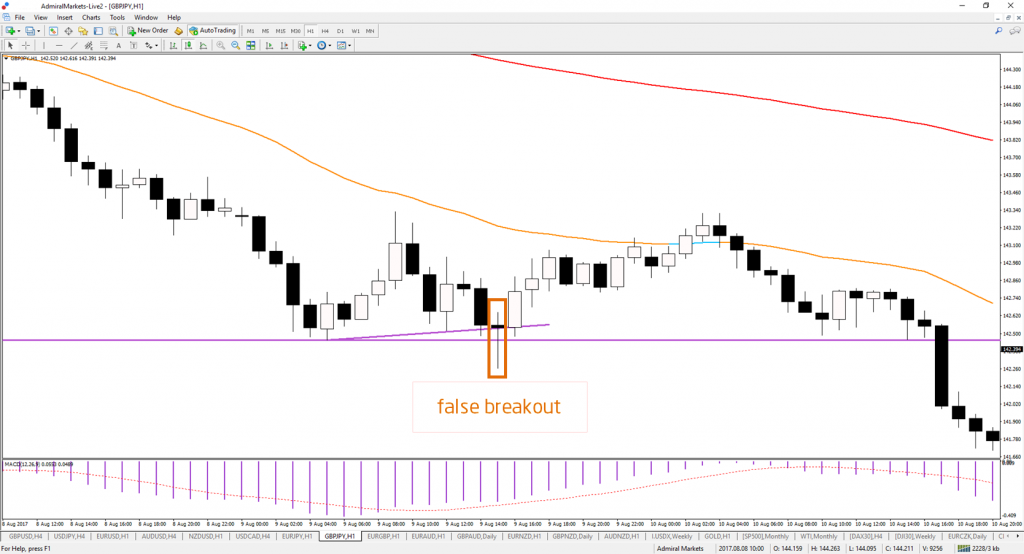
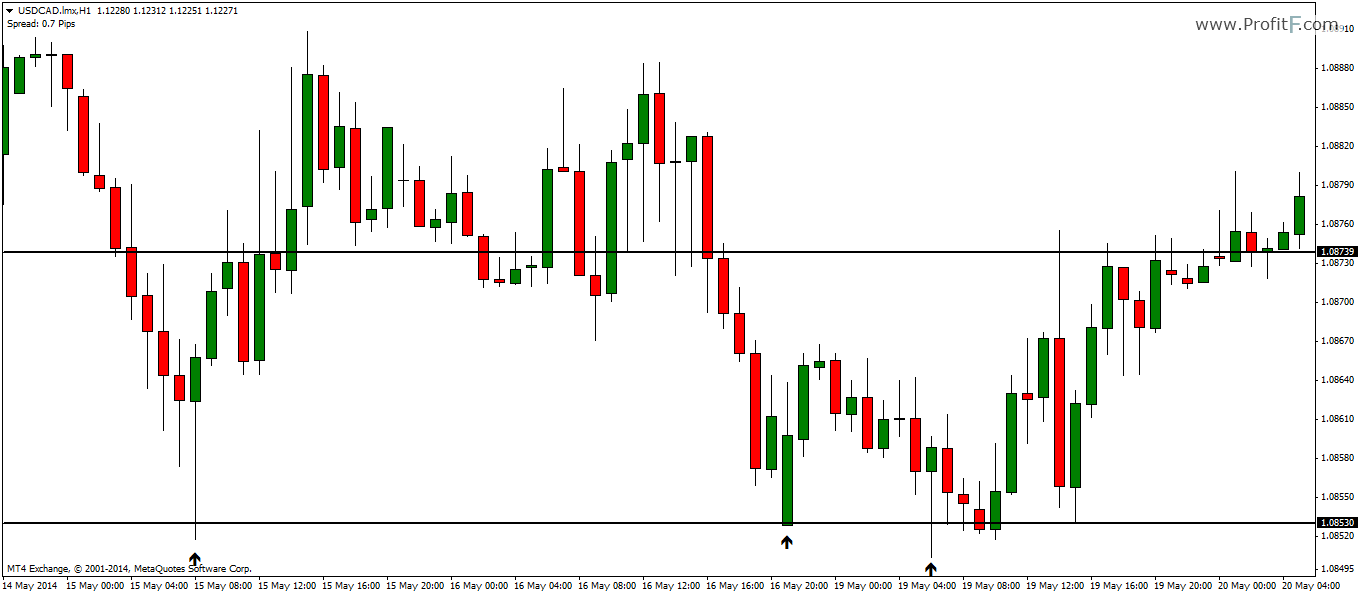
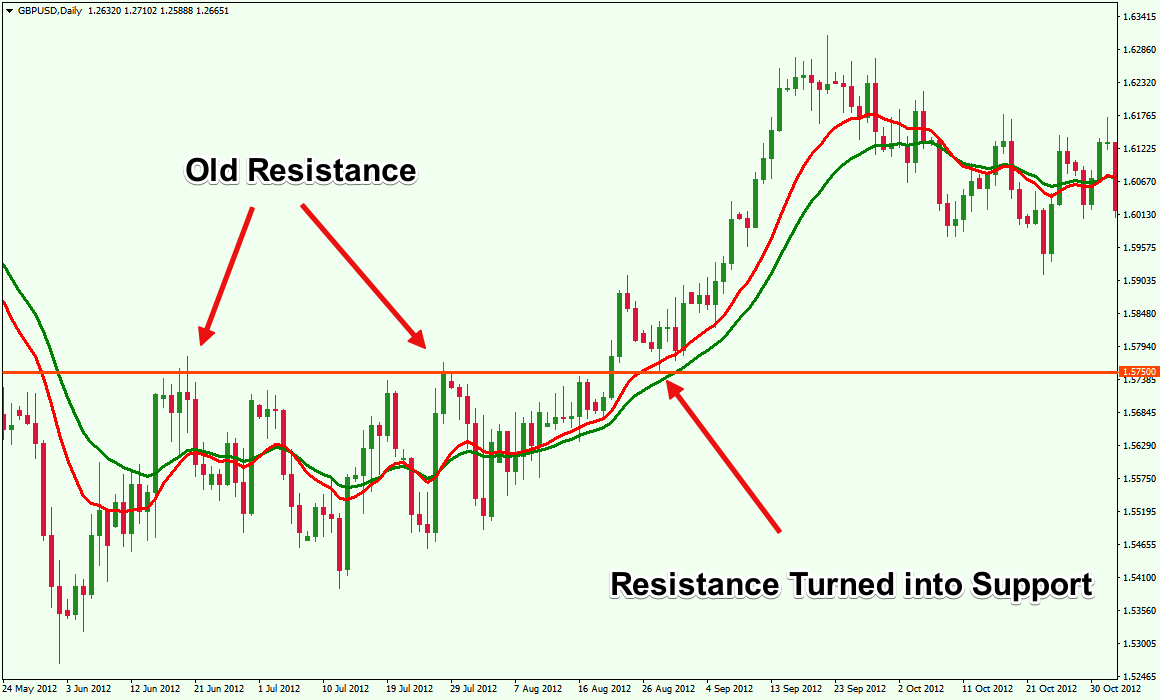
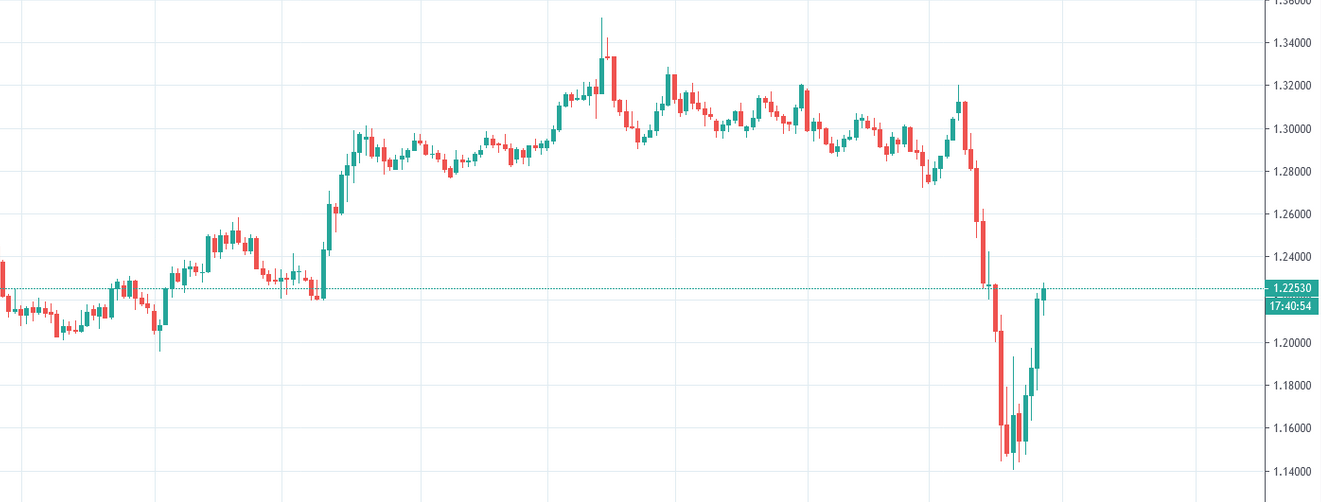
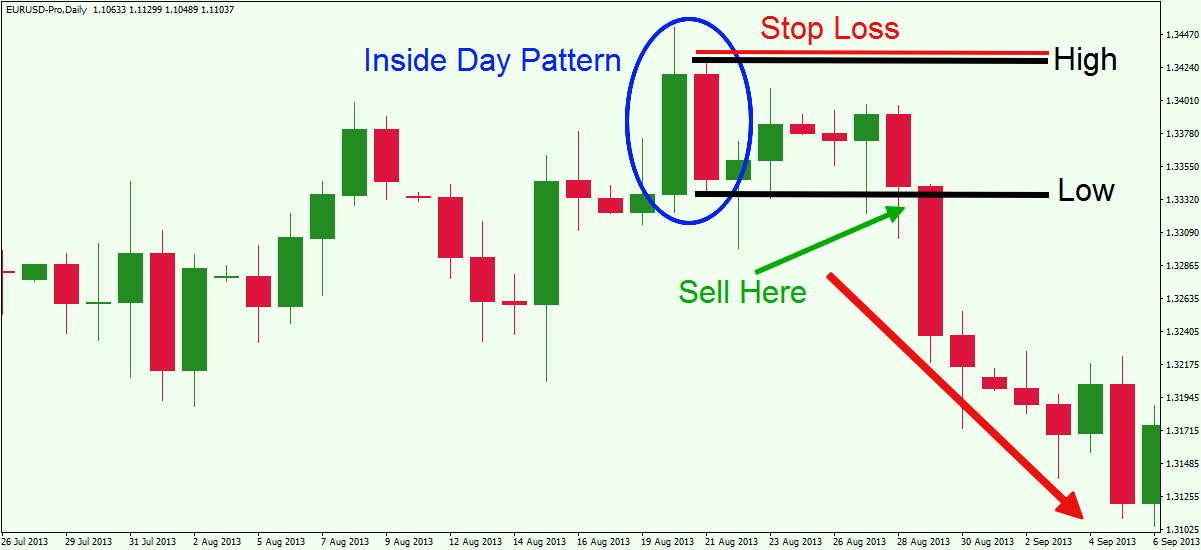
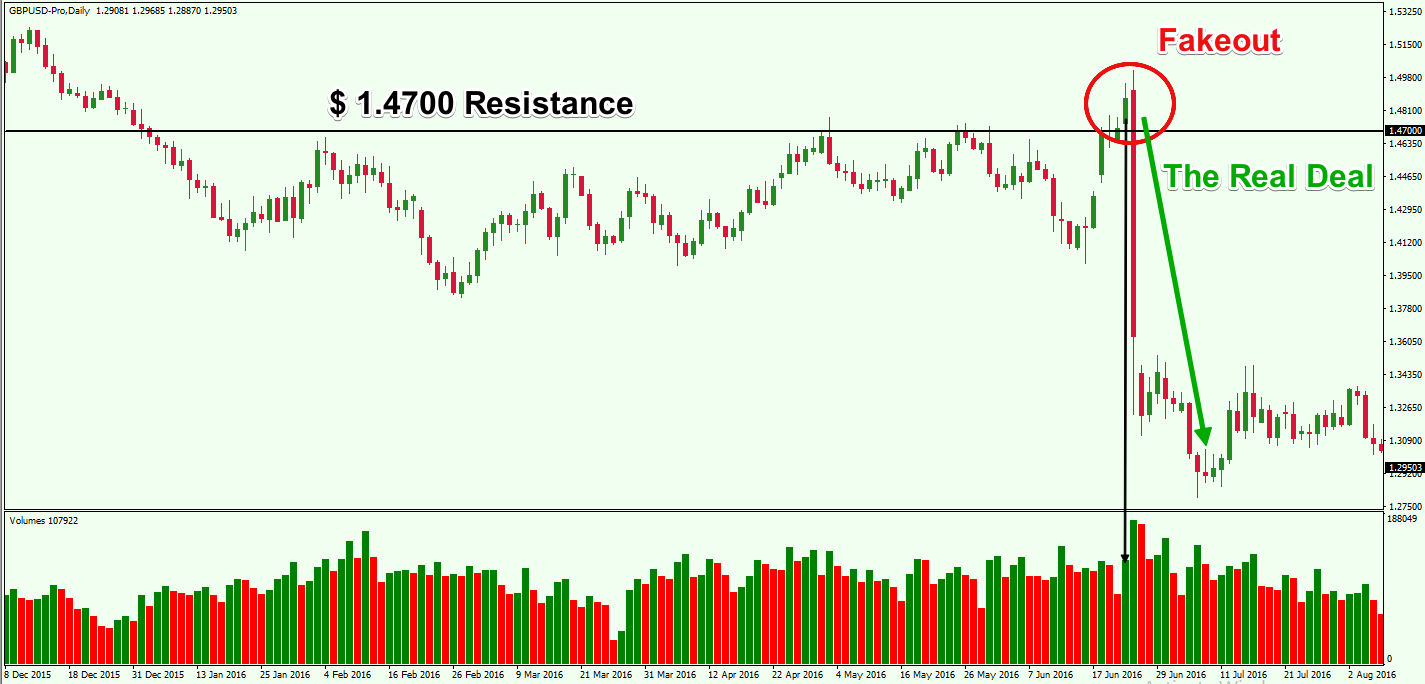
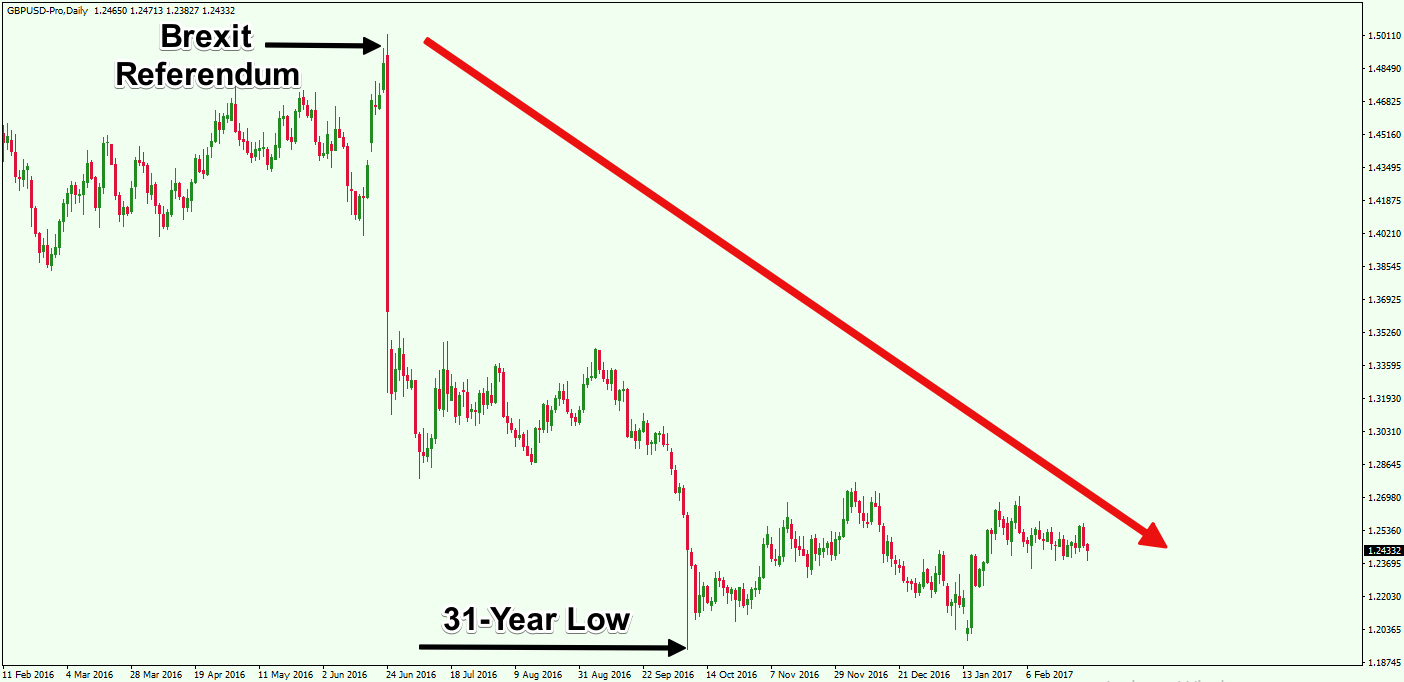
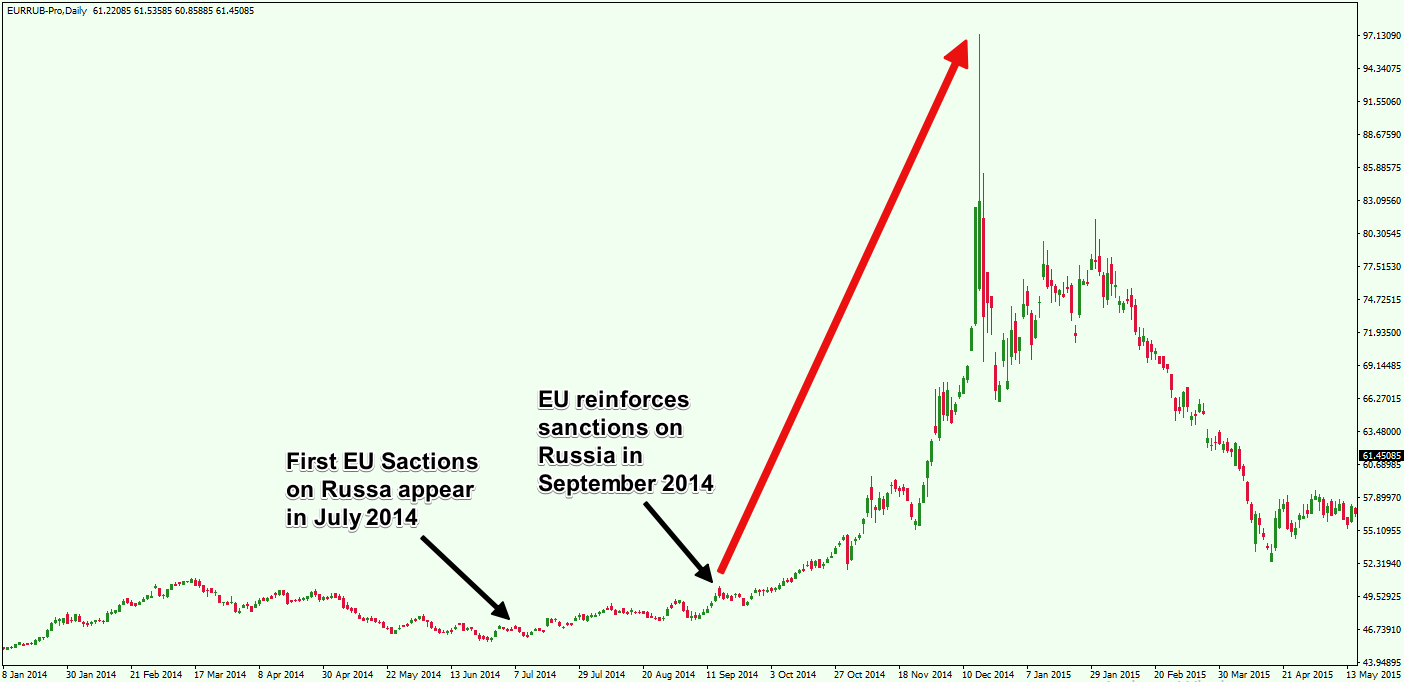
If you ask me you’d be better off staying away from shark infested markets. Because markets normally consolidate after long sustained trends. The big players are basically saying” We are tired. We need a break.” So when you put in a trade during consolidation, you risk blowing a crater in your trading account. The most painful part is you are giving away hard earned profits that you made from previous trades Let me show you exactly what I’m talking about using the GBP USD pair
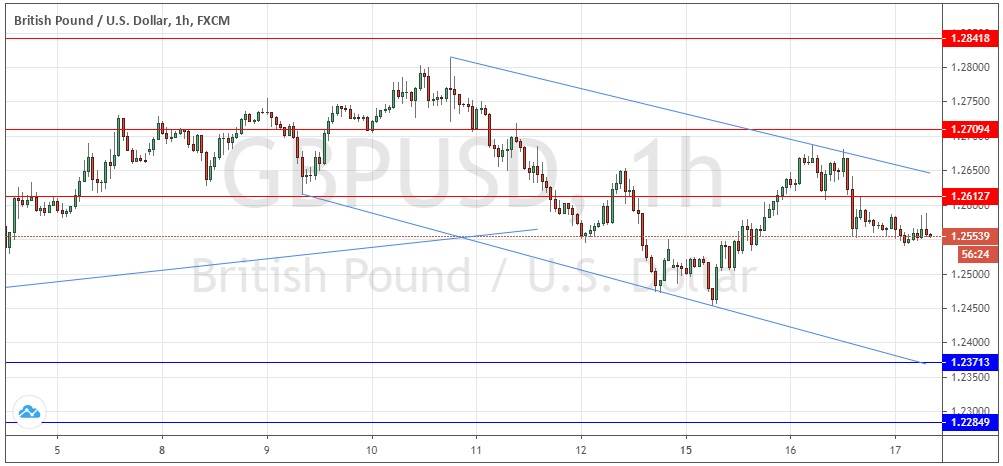
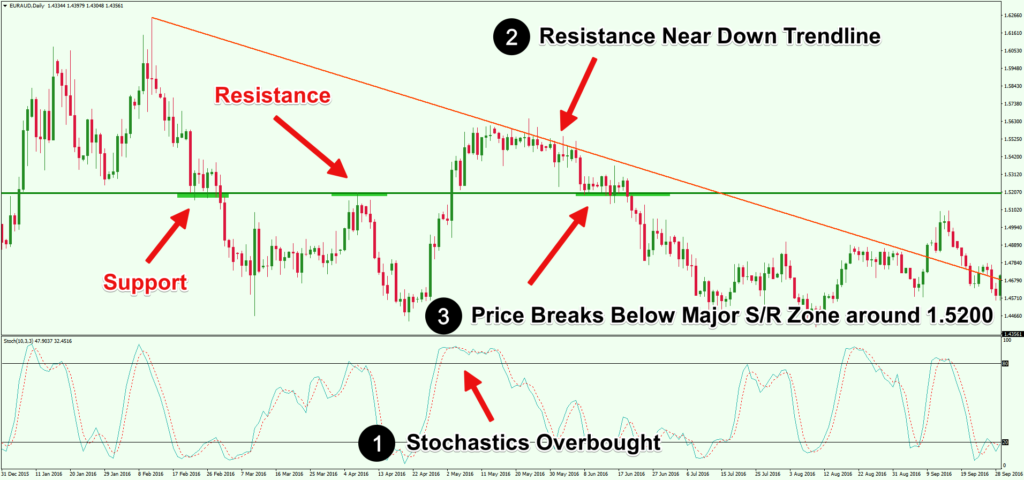
See the the choppy price action all over the charts All over the charts you see a period of strong trends followed by choppy price action so tight you could catch a hernia. Even more important there distance between the key levels is very small. So if you dare put in a trade entry in this setup you are toast.
Trading in this scenario is like gambling in Las Vegas. Because the market crawls like a tortoise in this setup you’ll end up chewing in your finger nails and wondering to yourself “Is this going to be a move or a breakout?” Next thing you know the sharks eat you up and the market sucks you out of your position. S word to the wise is more than enough.
I guess the question burning everybody’s mind is:
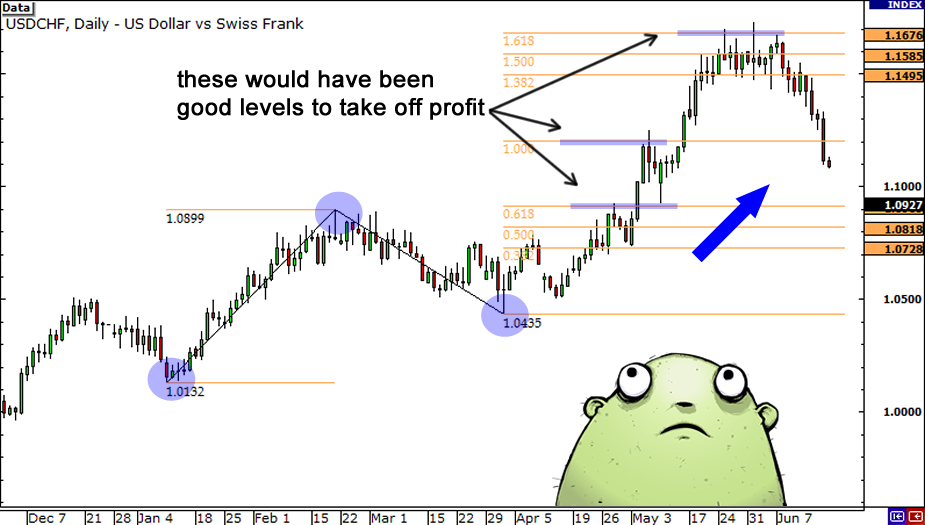
What Do I Do When I See A Sideways Market Worth Trading?
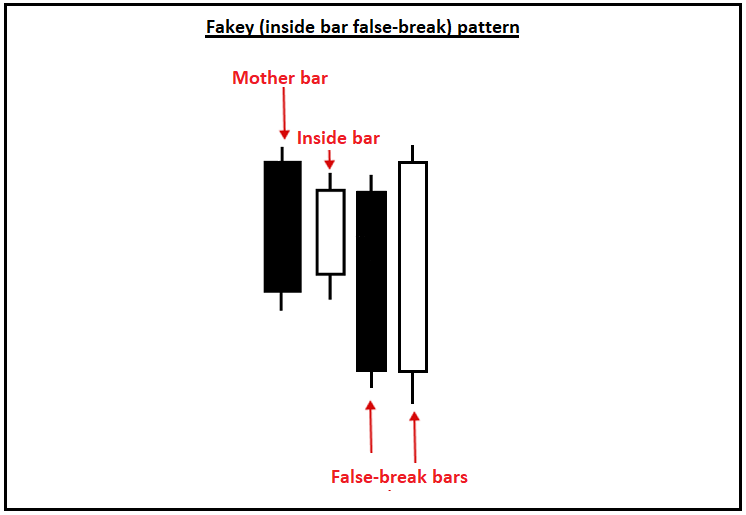
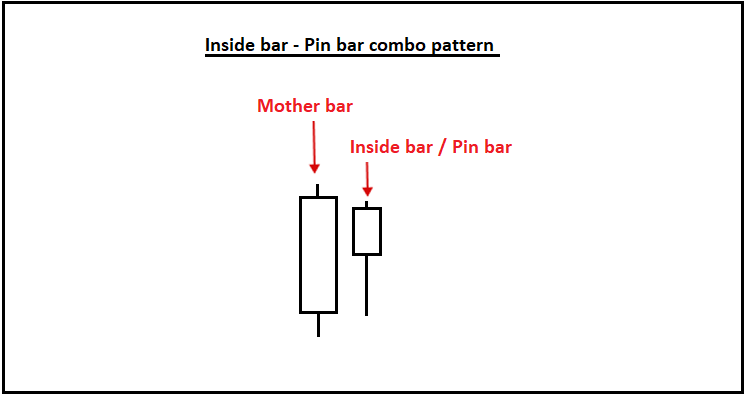
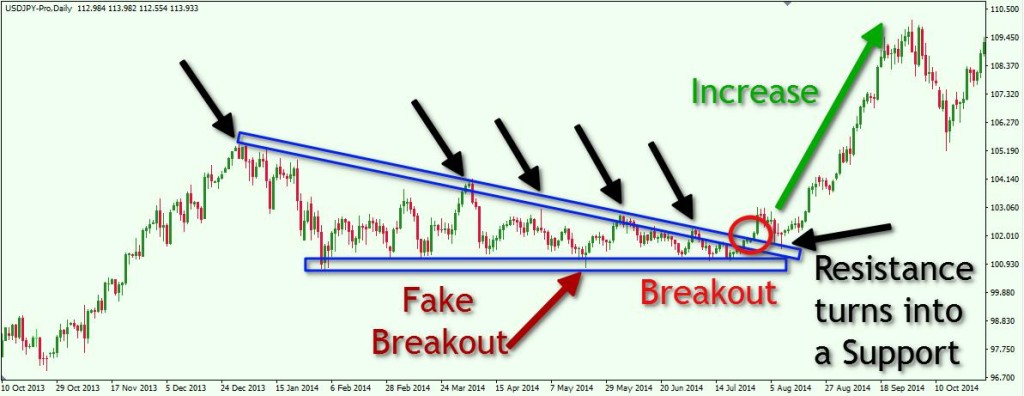
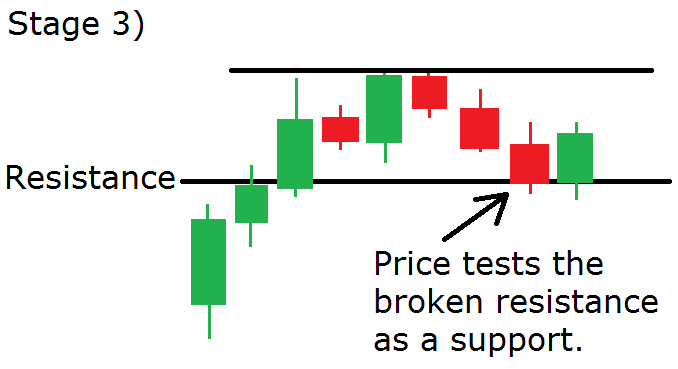
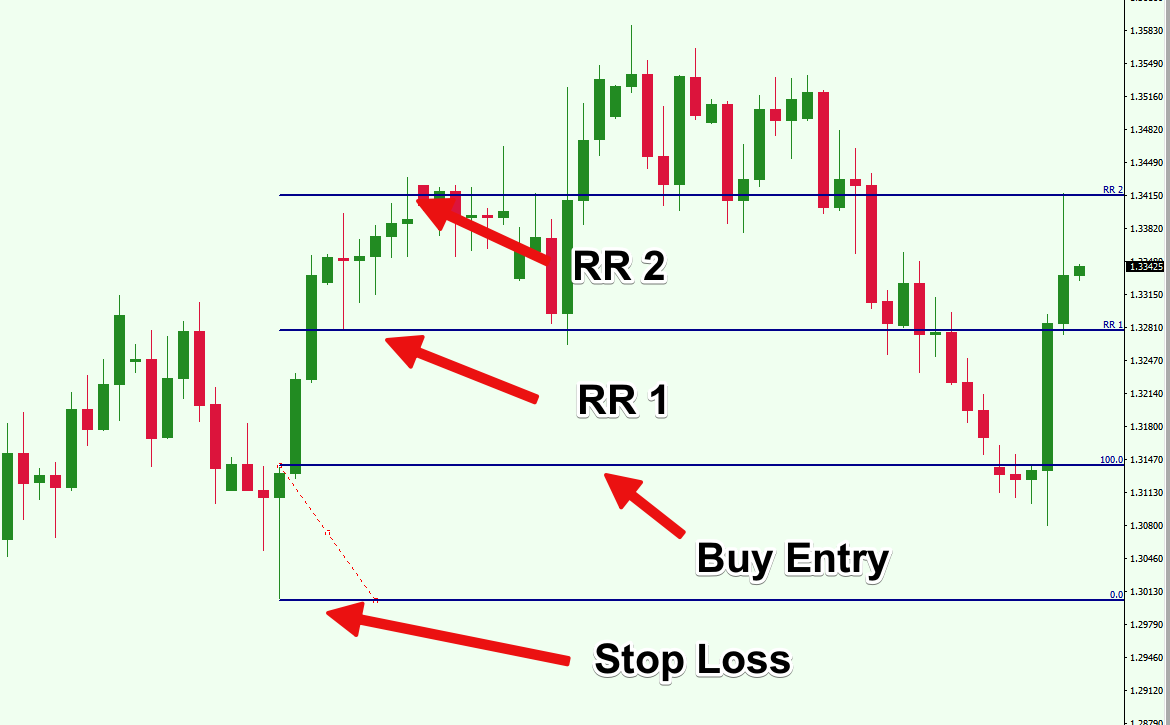
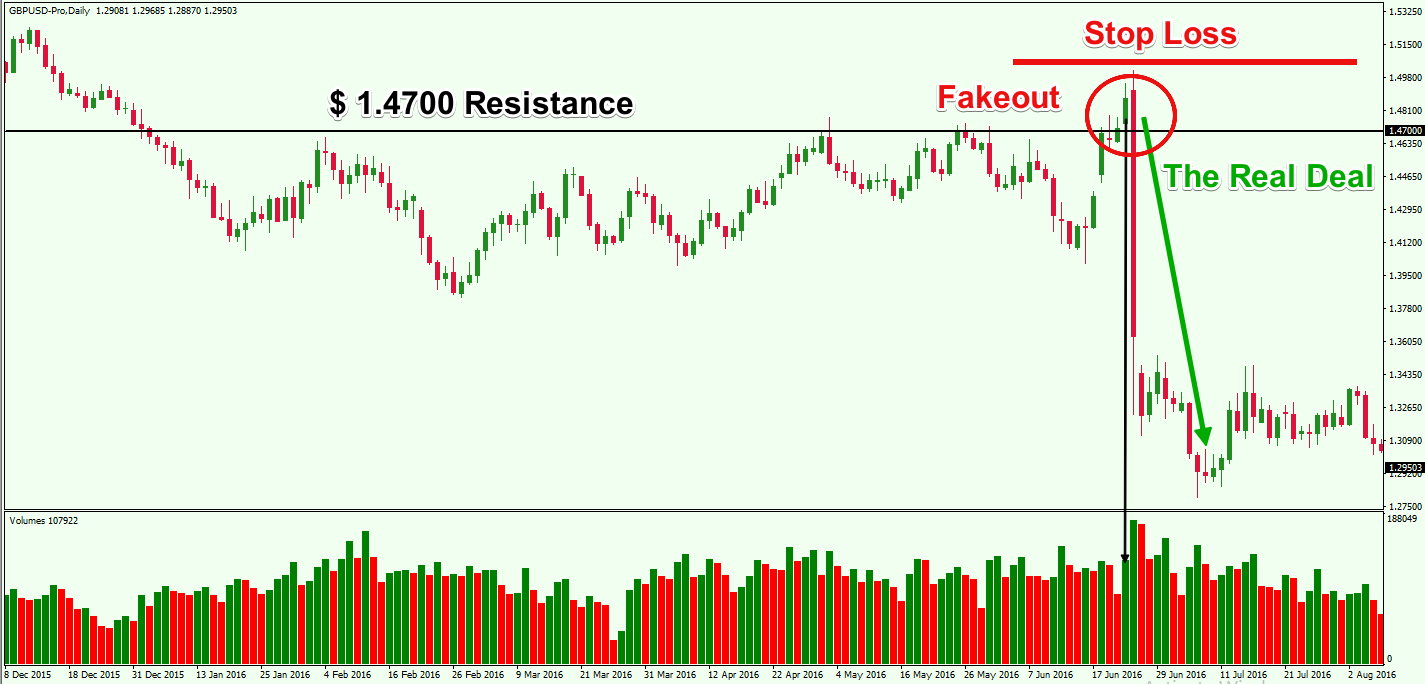
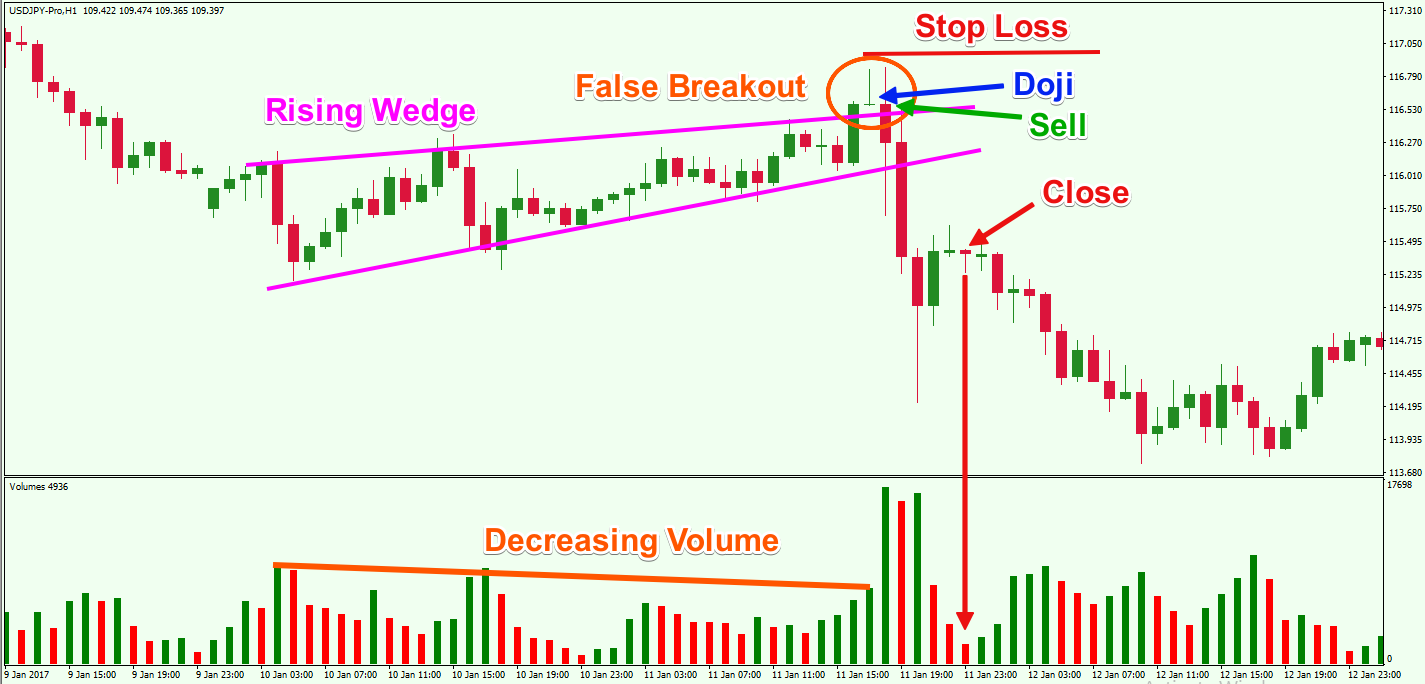
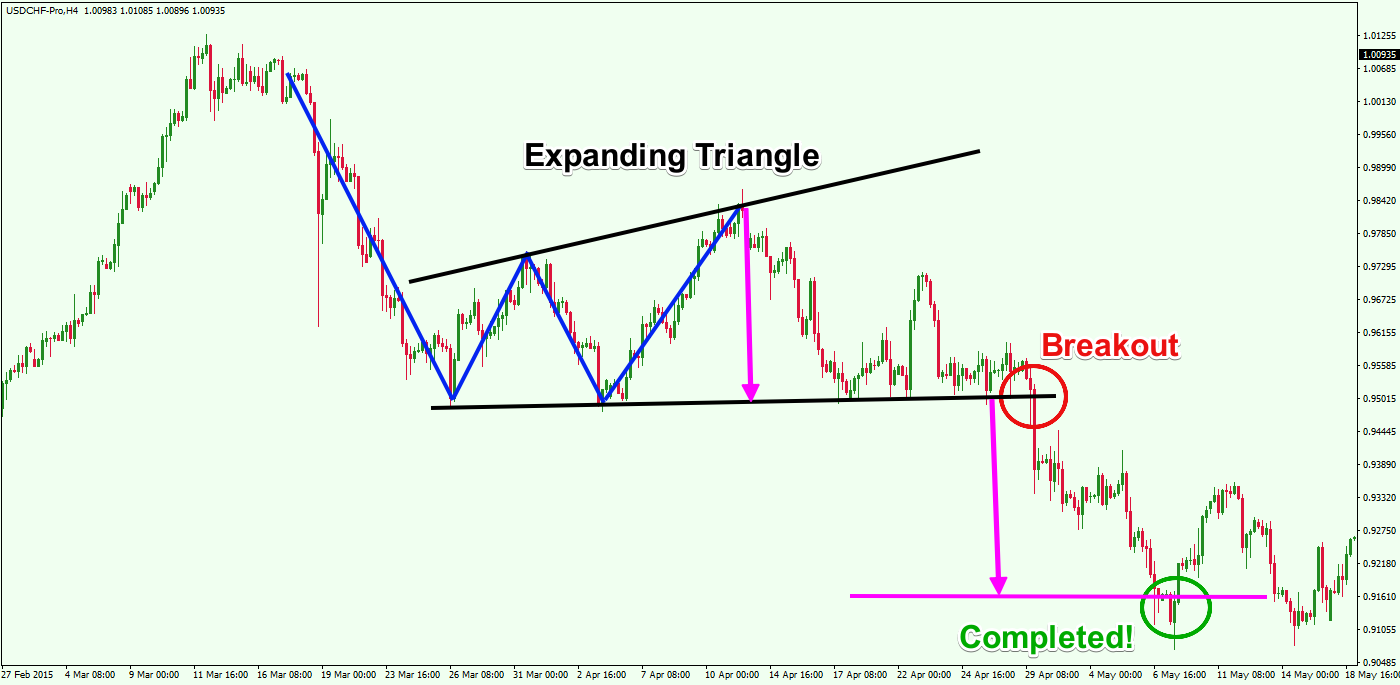
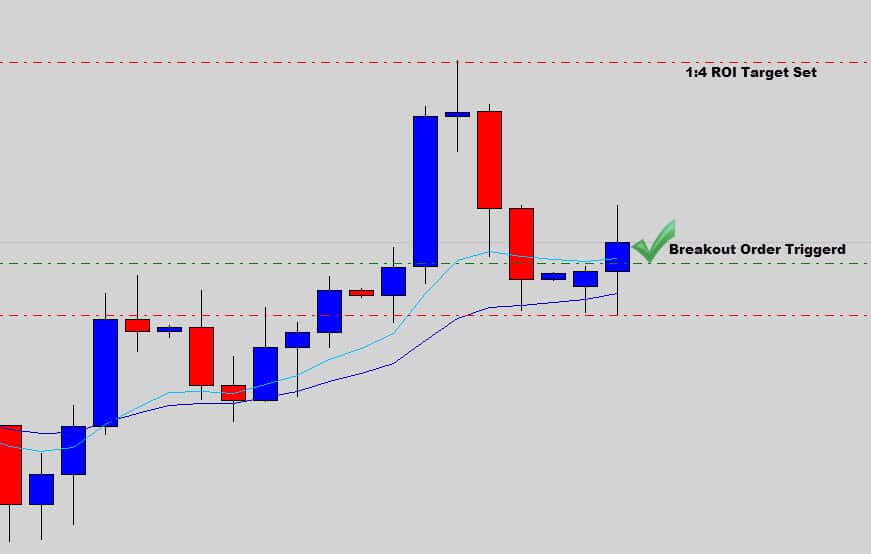
Just like any other market look out for price signals at the support and key levels of the ranges. The best way to go about is by applying the false break strategy. When you wait for the false break to take shape out of the trading range you increase your chances of making a decent profit. Every trading range has at least one false break in its tank. And these false breaks trigger humonogus moves in the opposite direction back towards the other end of the range.
However false breaks can blow holes in your trading account, If you get your timing all wrong you could be in for a long day on the markets. But the most important thing to remember is that false breaks present great trading opportunities. You just need to be as sharp as a marksman
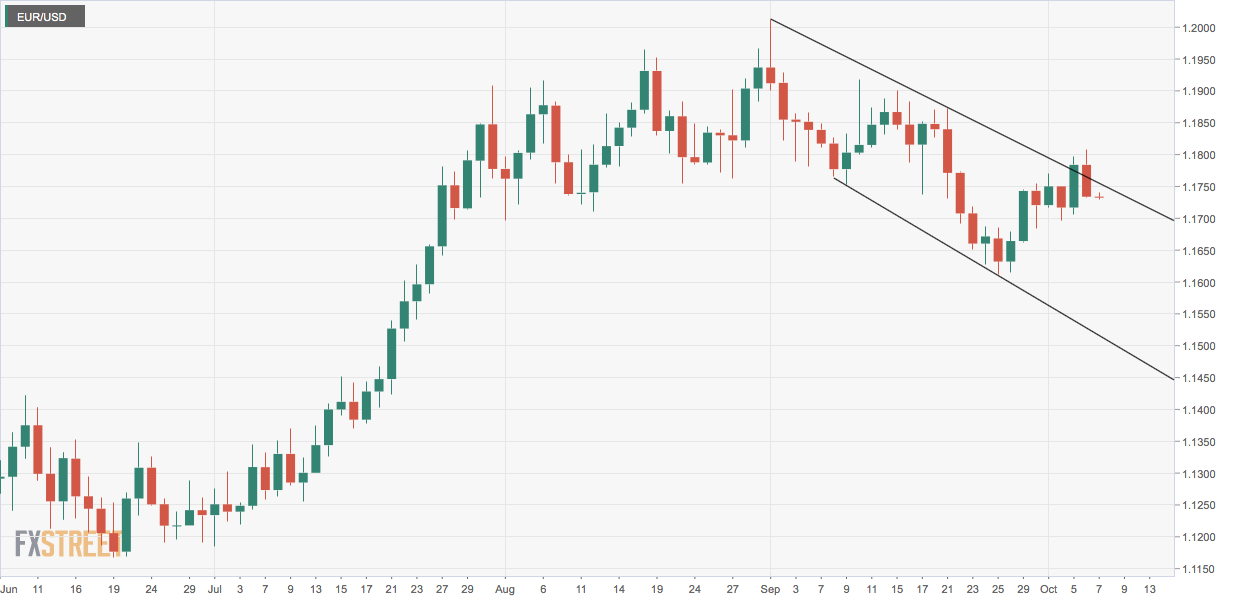
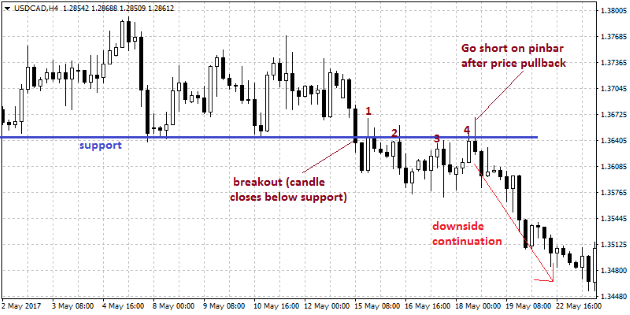
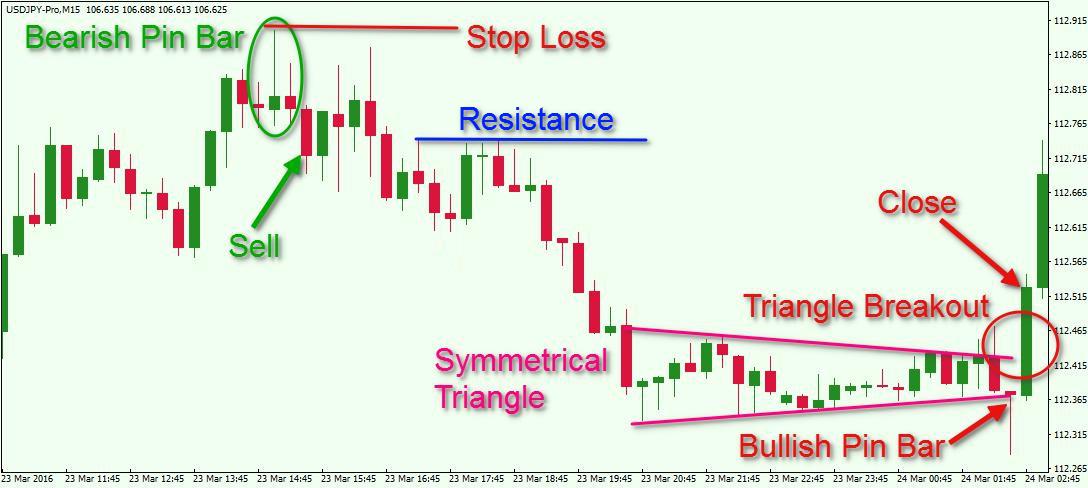
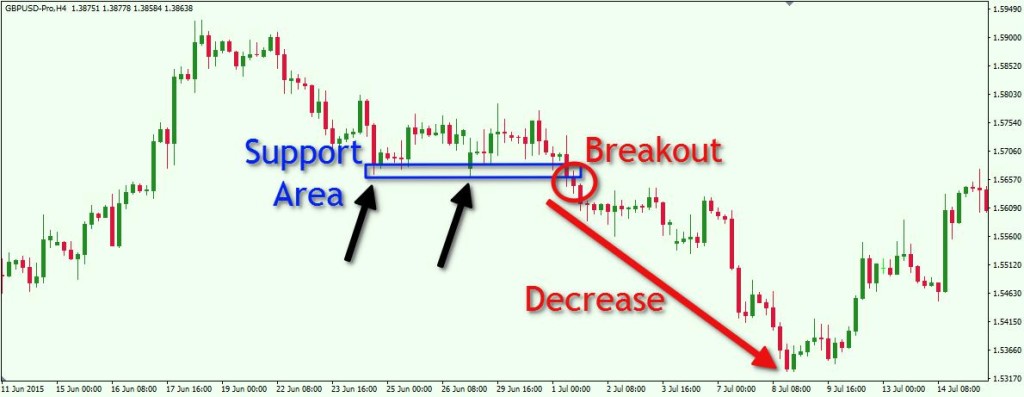
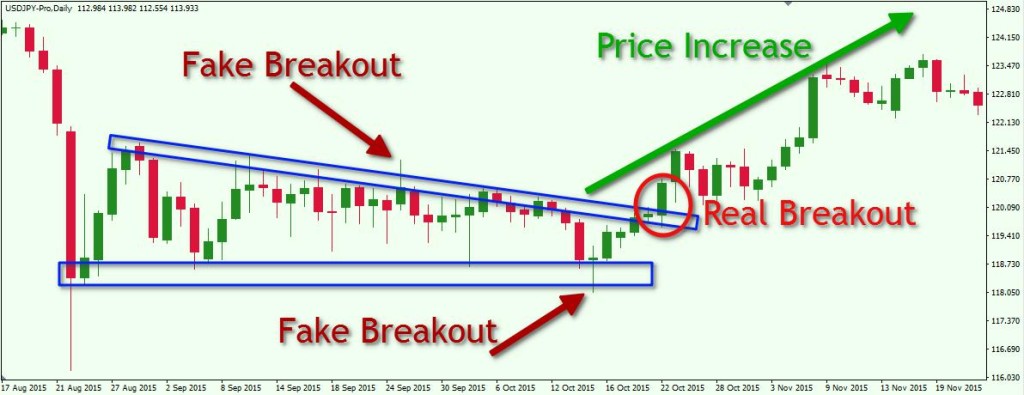
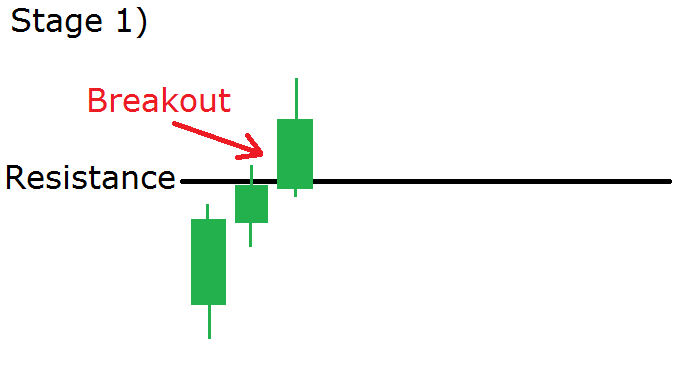
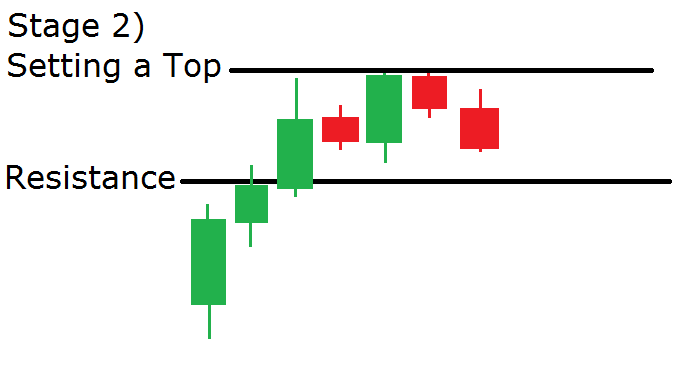
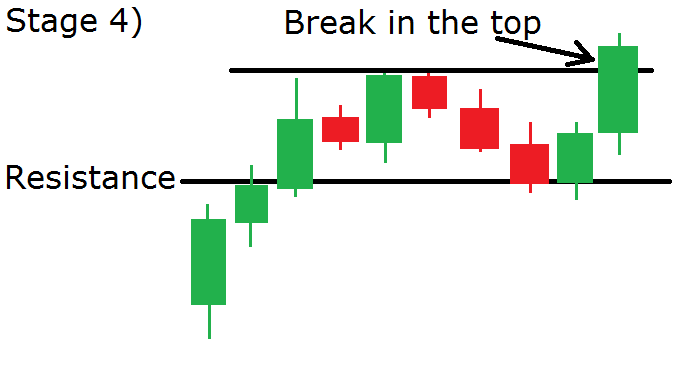
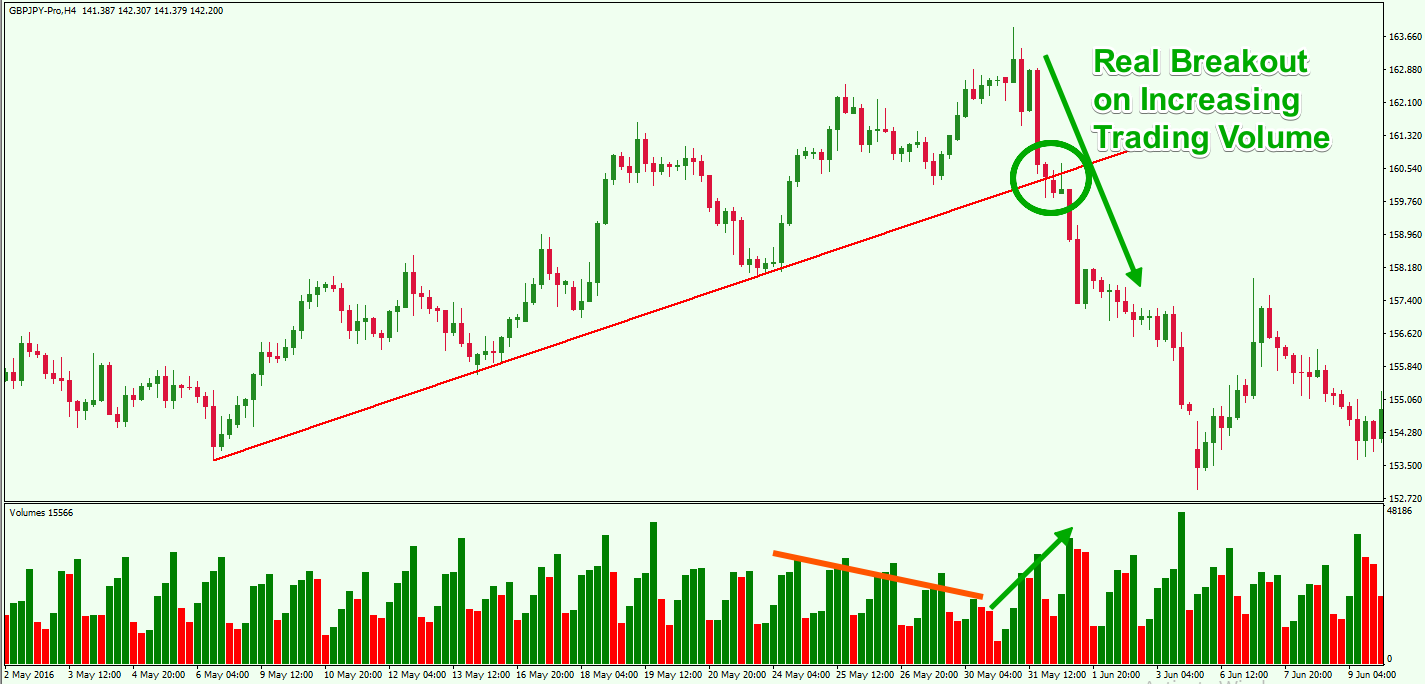
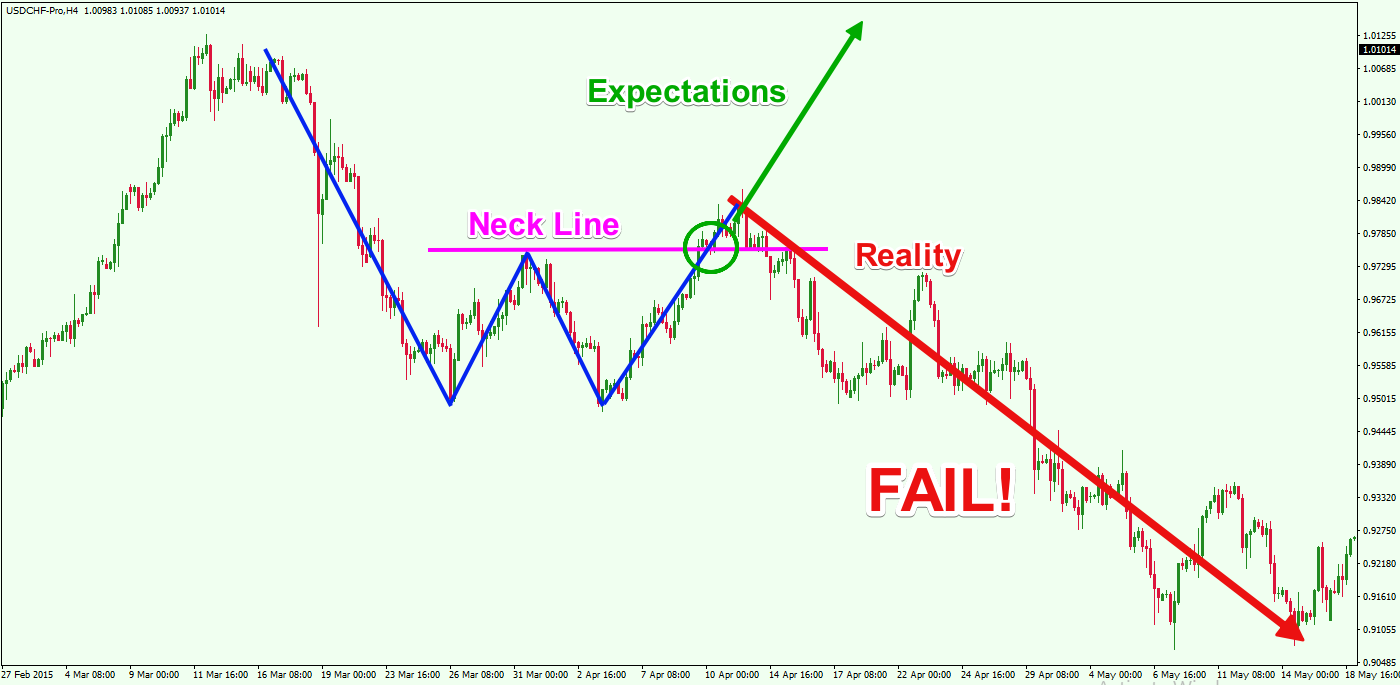
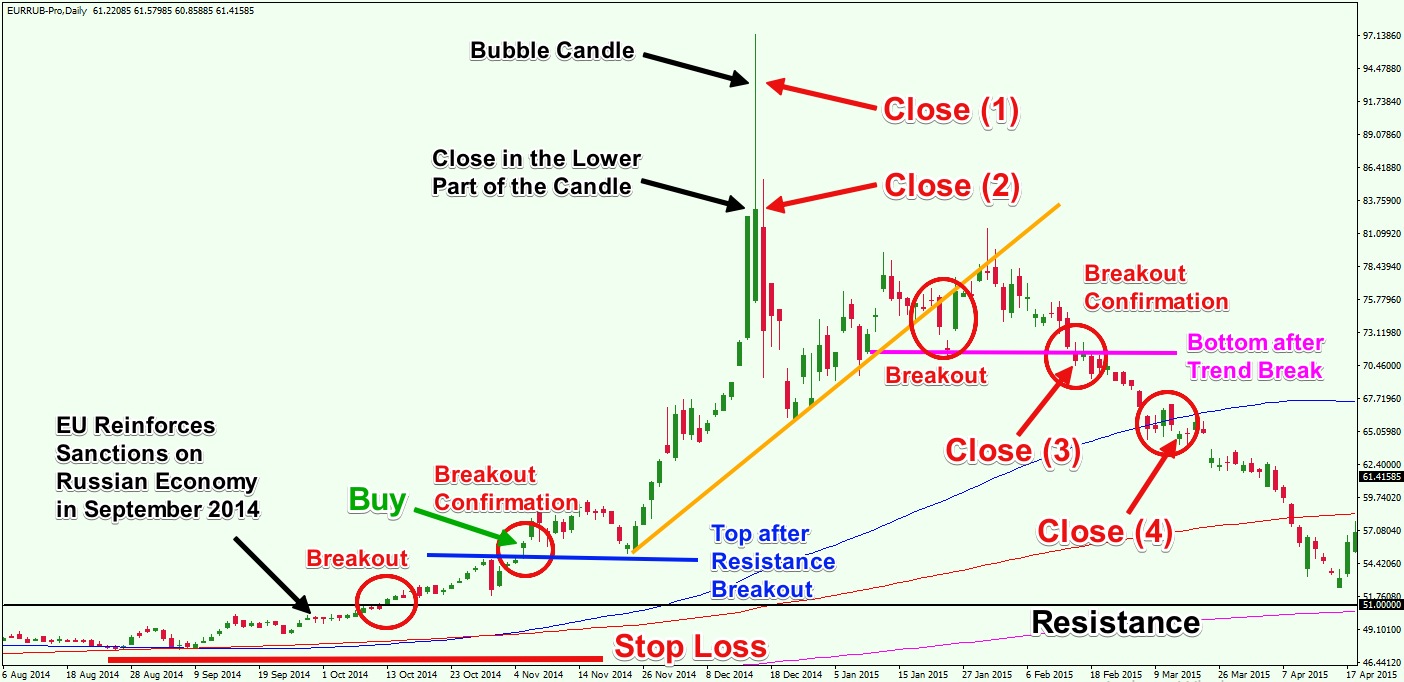
Dont bother following the herd when looking for false break opportunites. You may end up being sucked out of your trading position and lose a ton of money. When a breakout is legit, price closes outside the range for several days. It will then return to take another crack at the level that ot broke out of. And if the key level survives the retest, then it is a safe bet that the breakout was for real. But please don’t predict the possibility of breakouts as some traders are so fond of doing. This aint the lottery. Instead sit still and wait for the false break to take shape and then jump in like a lion hunting an antelope. Let’s take a look at an illustration below

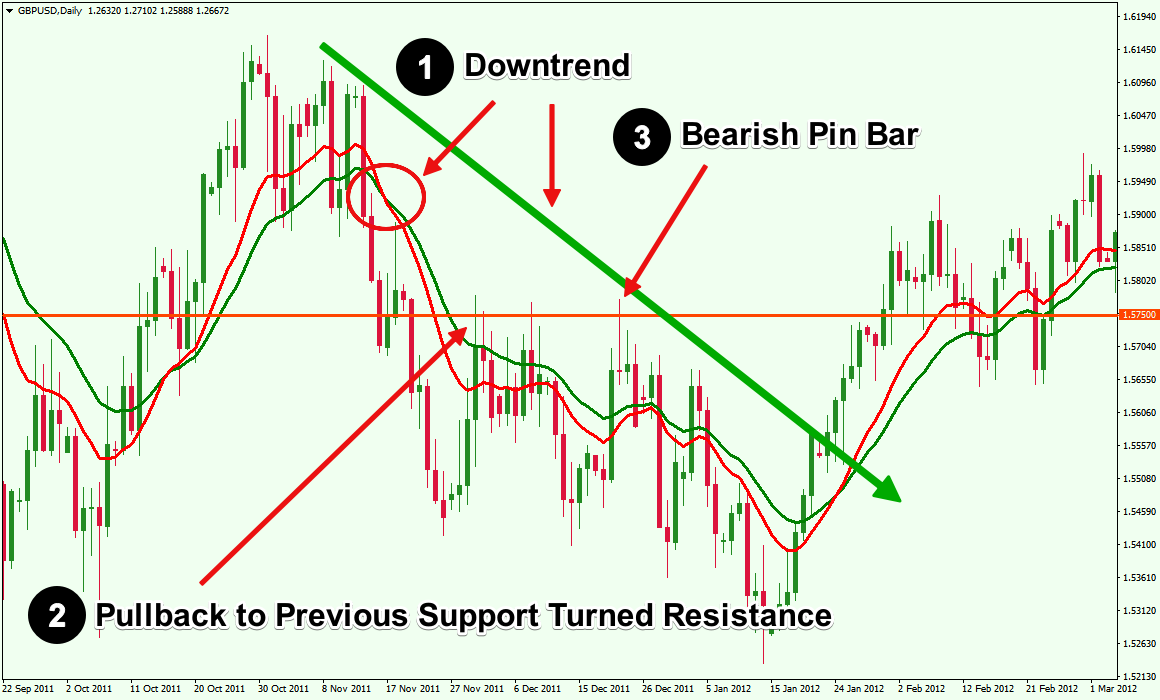
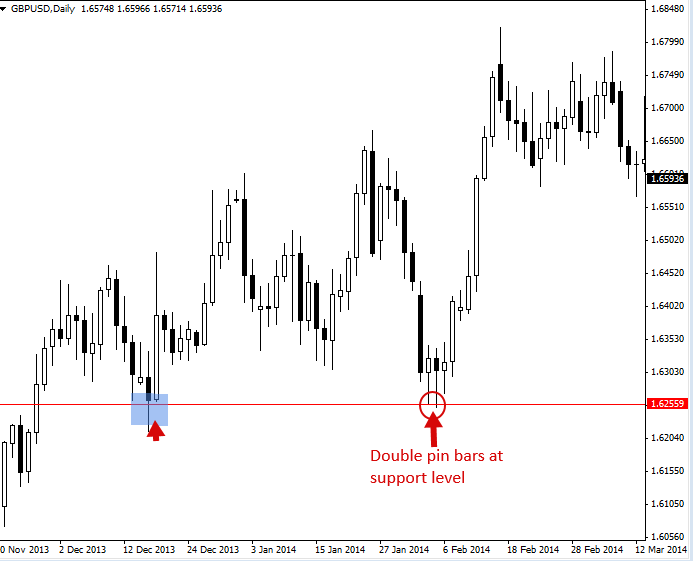
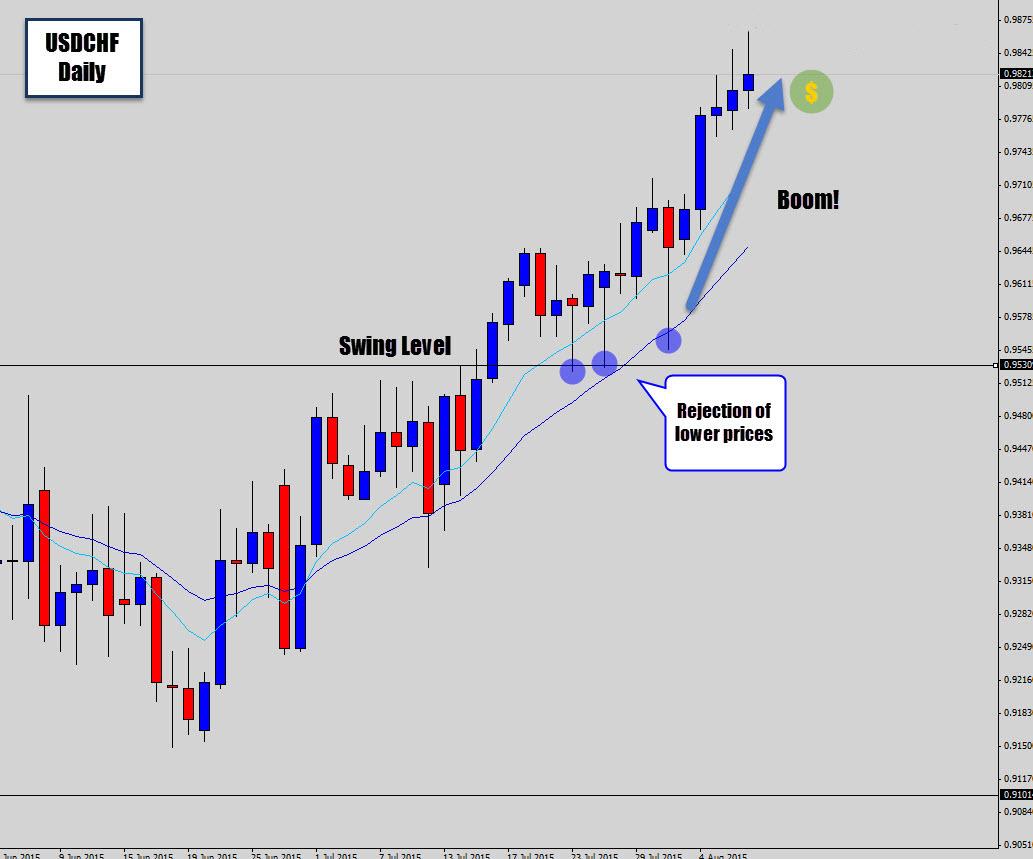
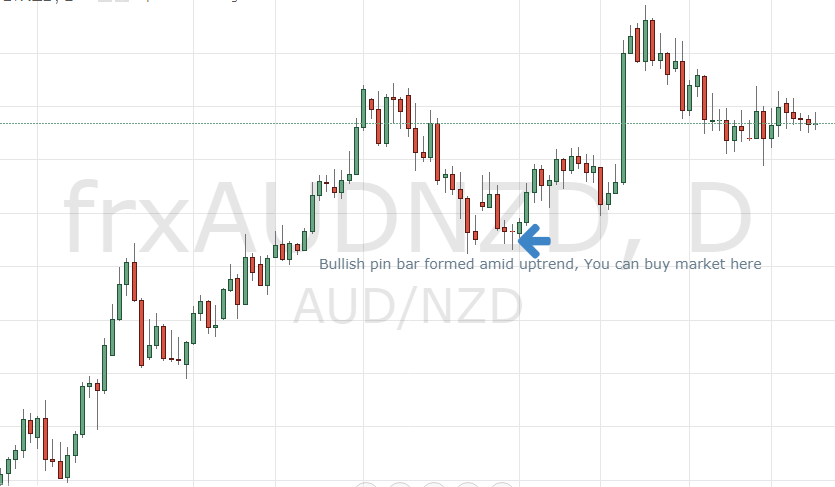
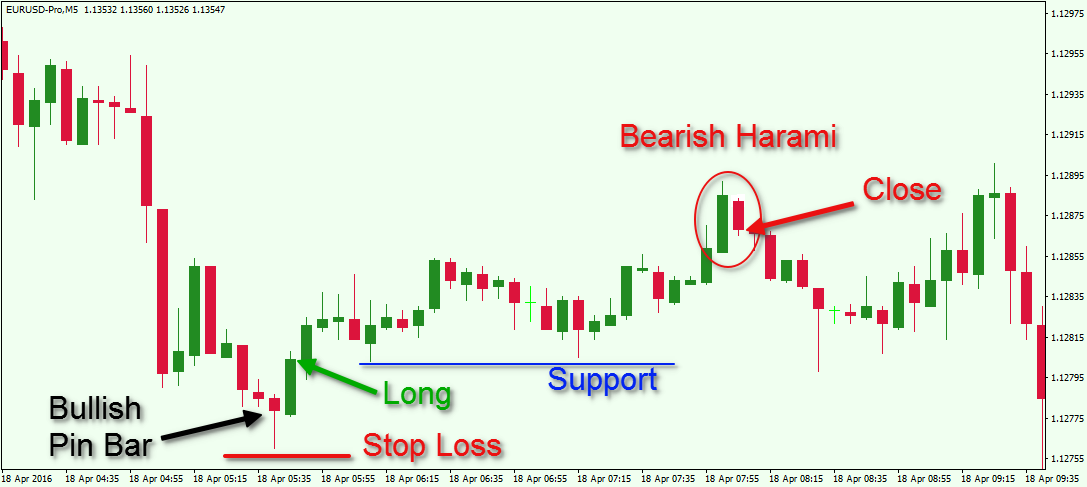
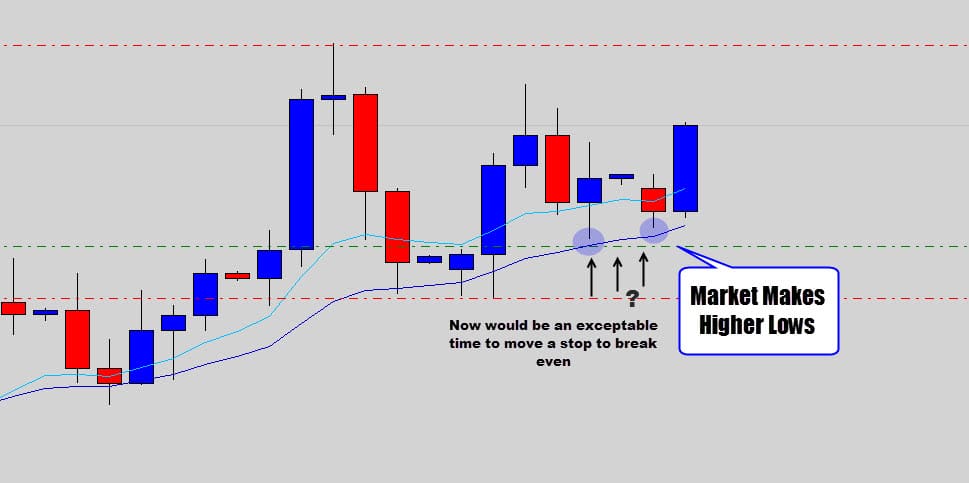
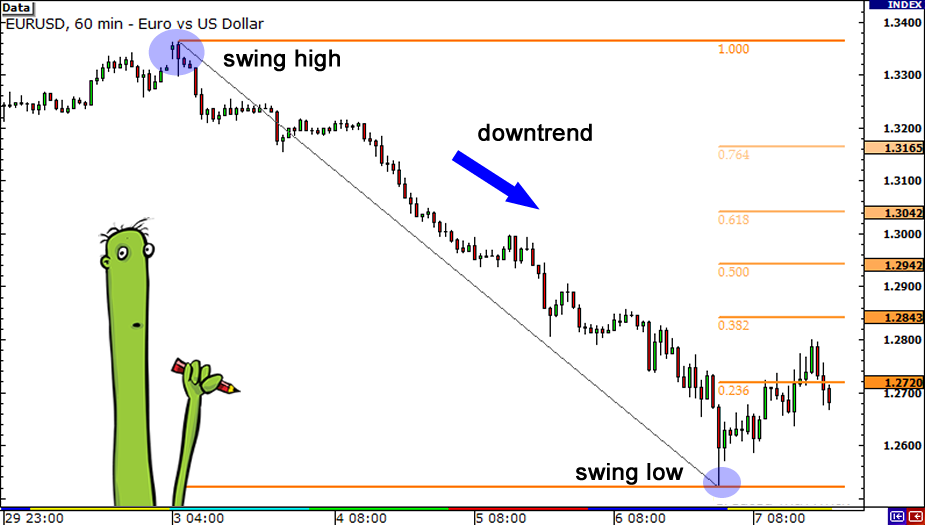
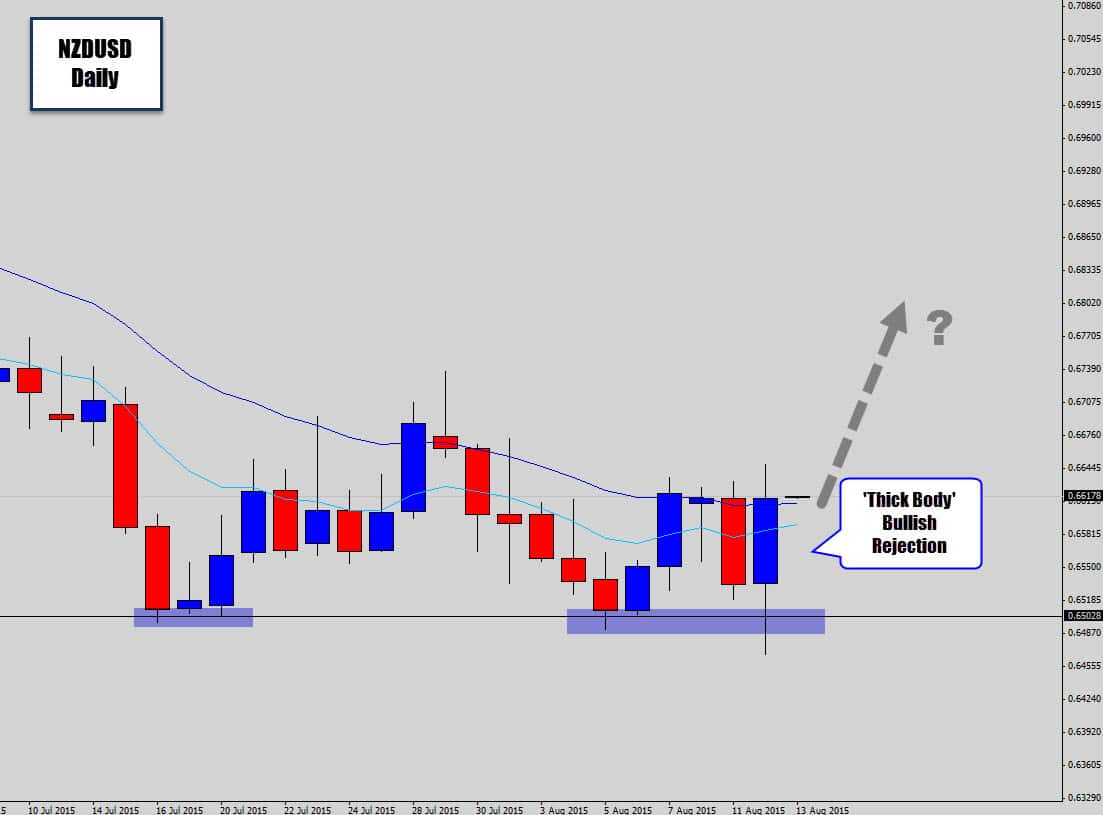
Here we have an obvious pin bar sell signal at the key support resistance level. Of course this signal triggered a huge slalom surge by the bears. And you know what means? Lots of moola along the trend The trend of course fades out with choppy price action taken over..
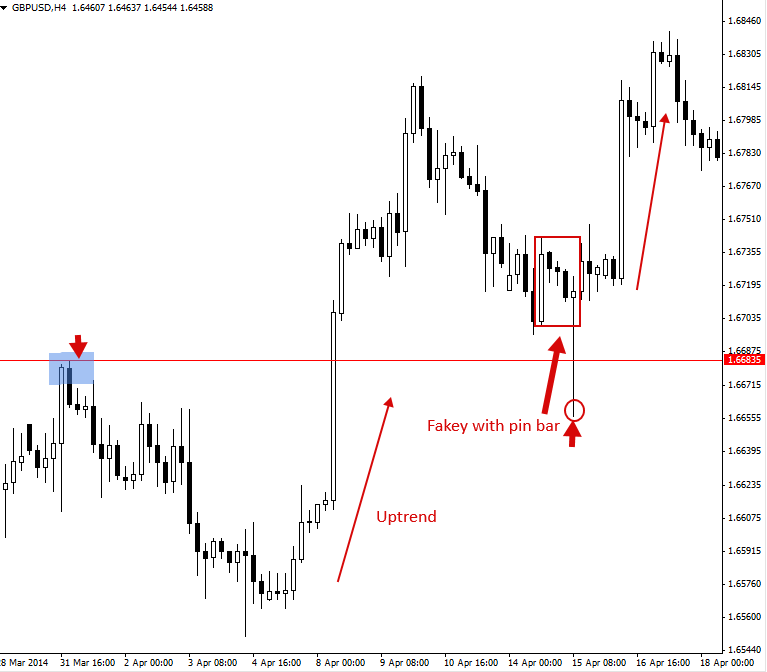
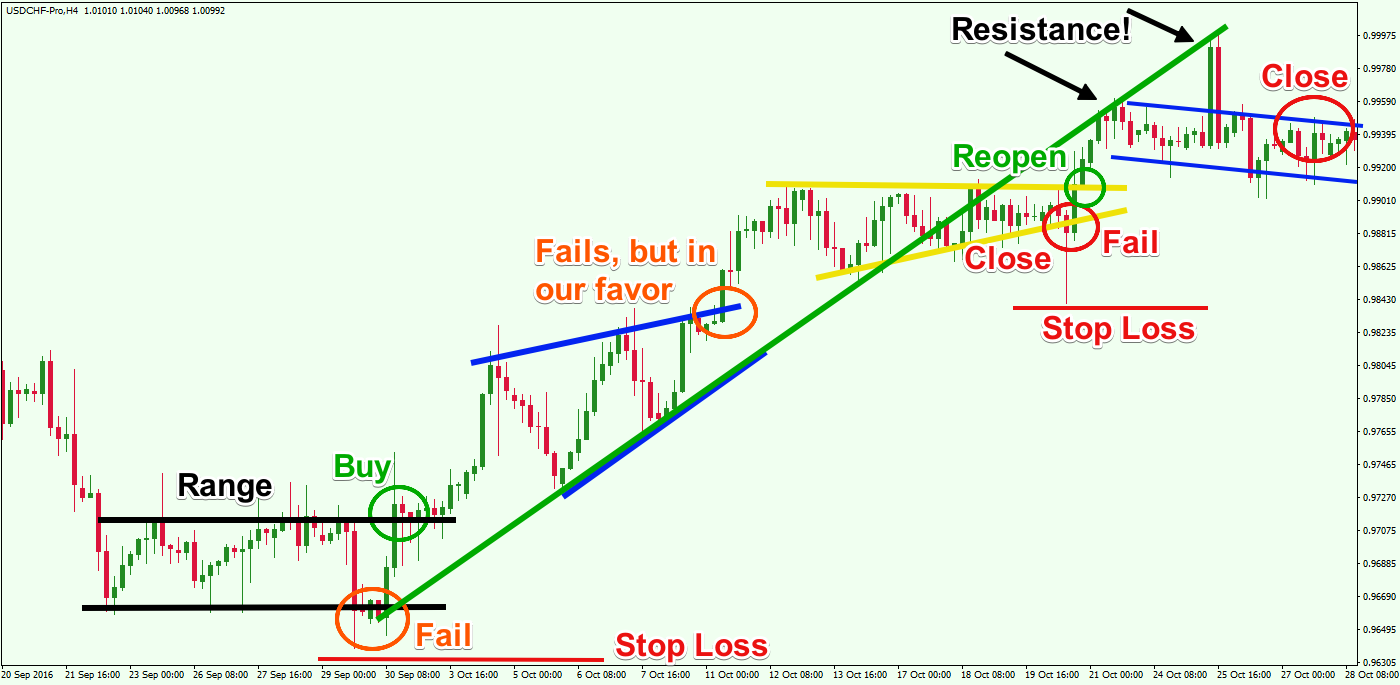
The same situation occurs along the line of support. Again a pin bat price signal triggers a huge surge upward surge for the hills by the bulls. And again it’s an opportunity to pick up profits along the way. Unlike the bears, the bulls don’t run out of breath that fast.
Last but not least
Don’t Blow Up Your Trading Account
It’s as simple as that. Isn’t it? If the opportunities to make a trade arent visible, stay put. Or else your account will go up in flamess. If the waters are choppy and not in range mode, keep your money and go for a walk. You would be better off getting some air rather than overtrading because you can resist the urge to stare at your screen all day.
If your favorite pair is in choppy waters check some other charts so if you can find a strong trend or a good trading range. Otherwise don’t force the trade as my friend and fellow trader Hunter Ripple once said. If there is no trade then there is no trade
That’s s wrap for “Four Sure Ways of Trading Forex Sideways.” Hopefully you ;ve learnt a thing or two about trading forex sideway markets. Forex markets don’t trend all the time. At some point they go ijnto consolidation. And when that happens dont bother trading. But when you do decide to trade a market that is skidding sideways, make sure that all the conditions are present for you to trade. Or else your your trading account will be upset with you.
Til next time take care.
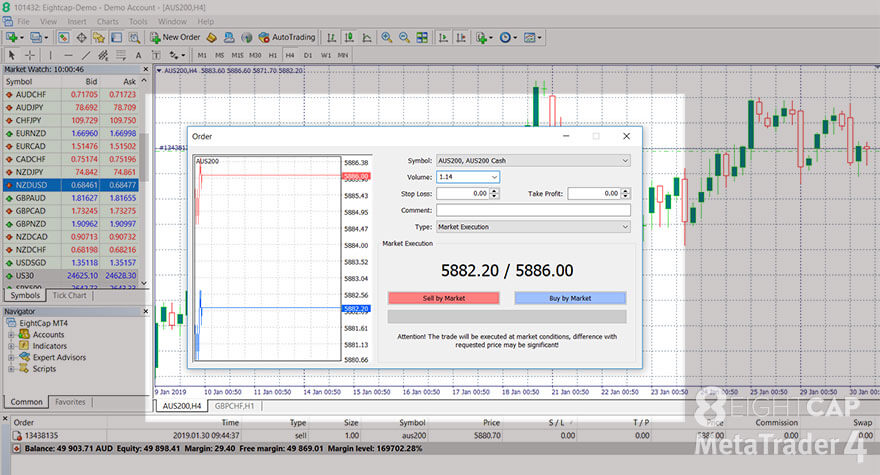
Opening Of Live Forex Trading Account
If you’re looking to open a live trading account Sign Up With Exness.
That’s s a wrap for “Trade Against The Trend…And Your Trading Account Becomes A Black Hole.” I hope you now understand that trading against the trend can be dangerous to your trading account, not to mention your health. When you trade on both sides of the trend you give back all your hard-earned profits like you are giving away confetti.
So What should be your New Year’s Resolution? Follow the dominant trend and avoid the countertrend like the plague. Your trading account will be the happier for that if you follow the direction of the trend.
Til next time take care.
Opening Of Live Forex Trading Account
If you