Hello and welcome to another edition of the bulls vs the bears. Today we are going to find out what separates price action event zones from support and resistance levels. Now you need to know price action even zones and support/resistance levels like the back of your hand. Now do I really have to go into what support and resistance levels are? I;m sure most of you know what these two levels are. If not, click here.
For your information, price event areas have been part of forex trading jargon for a quite while. It’s only recently that it’s being introduced into the forex trading main stream. So to avoid further confusion, I’m going to define what these two tools are. And then I’m going to dig deep into what separates these two wonderful tools.
First off:
What’s A Price Action Event Area?
Well, a price action event area is a critical horizontal area on a price chart where a price signal formed. In this same price action event area, you’ll also find a major trend move(uptrend or downtrend) or sideways range taken shape. These event areas are popularly know as hotspots on the price charts. You should watch these hotspots like a hawk in case in case they retrace(or pull back). If price happens to to touch these event zones, you can be sure the major players will start considering their options. Now let’s take a look at a price event area through the eyes of a pin bar signal.

Ladies and gentlemen. Laying in front of you is an illustration of the price event area through the eyes of a pin bar buy signal. The grey shaded ares represent both support and resistant areas. The arrows pointing downwards suggest price retracing after price bounced off both support and resistance levels. Now take look at the bulls blasting through the level of resistance thanks to a pin bar formation at the level of support.
Keep a close watch on the arrows pointing downwards at the line of resistance. The line of support converts into a line of resistance, and the bulls break through this key level and head for the mountains on the back of another pin bar formation. And when this happens, just rack up all the profits along this trail. Understand one thing about price event areas. When you miss out on a price signal, don’t panic. Just wait for price to retrace in the same event area and then you make your move.
Next up is:
Support and Resistance Areas
I’m sure most of you know by now that support and resistance areas are static horizontal levels that are drawn across the price chart. Let’s take a look at support and resistance levels.

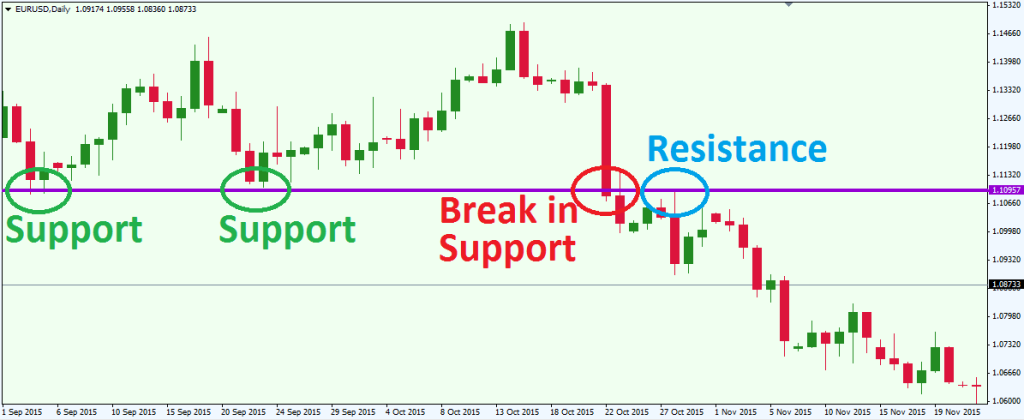
Ladies and gentlemen, this is an illustration of support/resistance levels, using the EURUSD pair. These are standard support and resistance levels drawn across highs and lows.
However, there are instances where the support and resistance lines are a more elaborate and longer in length than this example here, So don’t hit the panic button just yet. Now let’s look at support/resistance levels a daily chart time frame, using the AUDUSD pair.

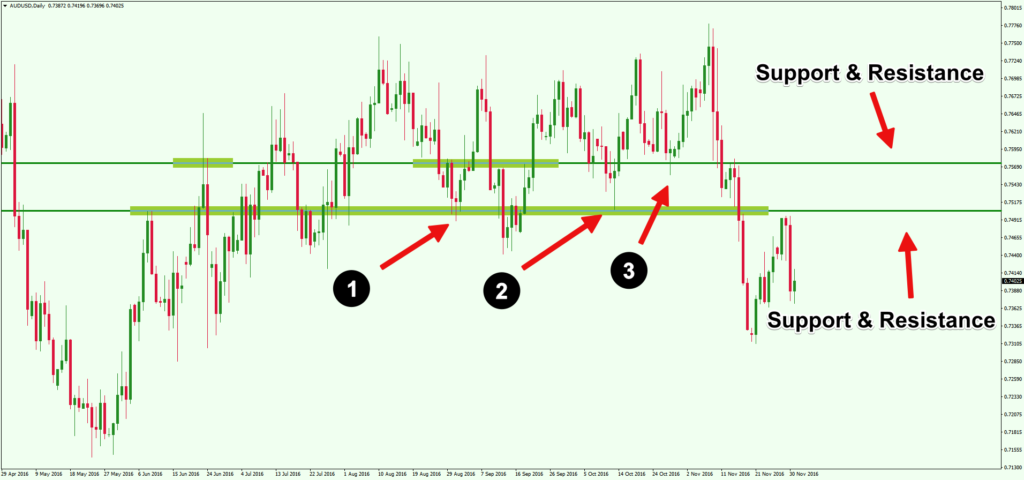
Ladies and gentlemen, here is another illustration of support/resistance levels using the daily chart time frame. Unlike the previous example, you don’t see any an event area in evidence on this chart. However, price event areas reflect a major price occurrence at the support/resistance levels. Plus, event areas carry a higher premium than support/resistance areas.
Now to the question du jour(of the day):
What Separates Price Event Areas From Support and Resistance Areas?
This may sound crazy to some of you. But every even zone is a support resistance area, but not every support and resistance area is a price event zone. This begs the next question:
How Do I Tell The Difference?
You see in a price event zone, a price signal suggests a huge breakout from a consolidation area or key level. Let’s take a look at an illustration using the power of confluence.

Ladies and gentlemen, right in front of you is an illustration of a price event area using the AUDUSD pair. The black circled numbers and the red arrows represent price signals long the key levels.
The price signals spark major breakouts at both support and resistance levels. And when such an occurrence takes place, nobody has to tell you that you are looking at a price event area. If you want to find out more about multiple price signals look up Something Called Confluence.
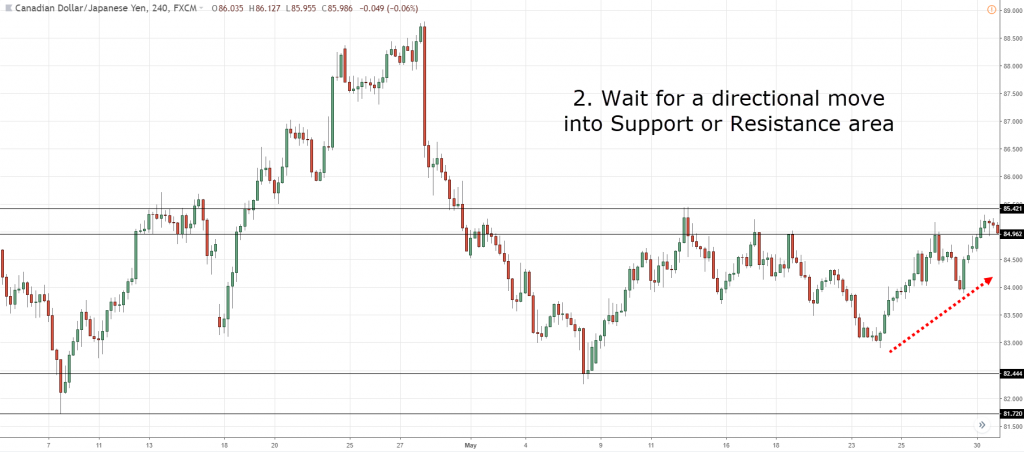
Now let’s use the CADJPY pair to ascertain why support/resistance is not a price event area.

If you look at the price chart you’ll see that there is no sustained consolidation before the breakout. Even worse, there is no evidence of a price signal triggering the breakouts in either the support or resistance levels. Even worse, we don’t see any price signal triggering a breakout at neither the support nor the the resistance levels. S you see why I say the support and resistance levels
That’s a wrap for “A Closer Look At Price Action Event Zones And Support & Resistance Levels.” As you can see price action event zones and Support/resistant levels help you understand the overall dynamics of the formation of a trade. This give and go between the price signal/entry and the market conditions give rise to the high probability opportunities. Til next time take care.
Til next time take care.
Open Live Forex Trading Account
If you’re looking to open a live trading account Sign Up With EasyMarkets