Hello and welcome to another edition of the bulls vs the bears. Today we are going to learn how to take advantage of forex chart pattern chaos. We are basically going to learn how to trade and profit from forex chart pattern failures.
Sometimes chart patterns can be very unpredictable. . You see a chart pattern that has huge profit potential written all over it. You put in your trade order only for the trade pattern to do a massive U-Turn, leaving your trading position exposed to a massive loss. That’s what forex chart pattern chaos is all about. So we’ll define what forex chart pattern chaos is all about and then we’ll touch on how to trade and profit from the ensuing chaos.
But first off:
What is Forex Chart Pattern Chaos?
Forex chart pattern chaos transpires when a specific chart pattern fails to take shape as expected. Consequently,price action does a fakeout instead of going according to plan. This in turn triggers an avalanche of stop orders from traders to salvage their trading positions. Fortunately for sometimes, out of this chaos comes great opportunities to make profits.
Let’s take a look at an illustration of a chaotic chart pattern
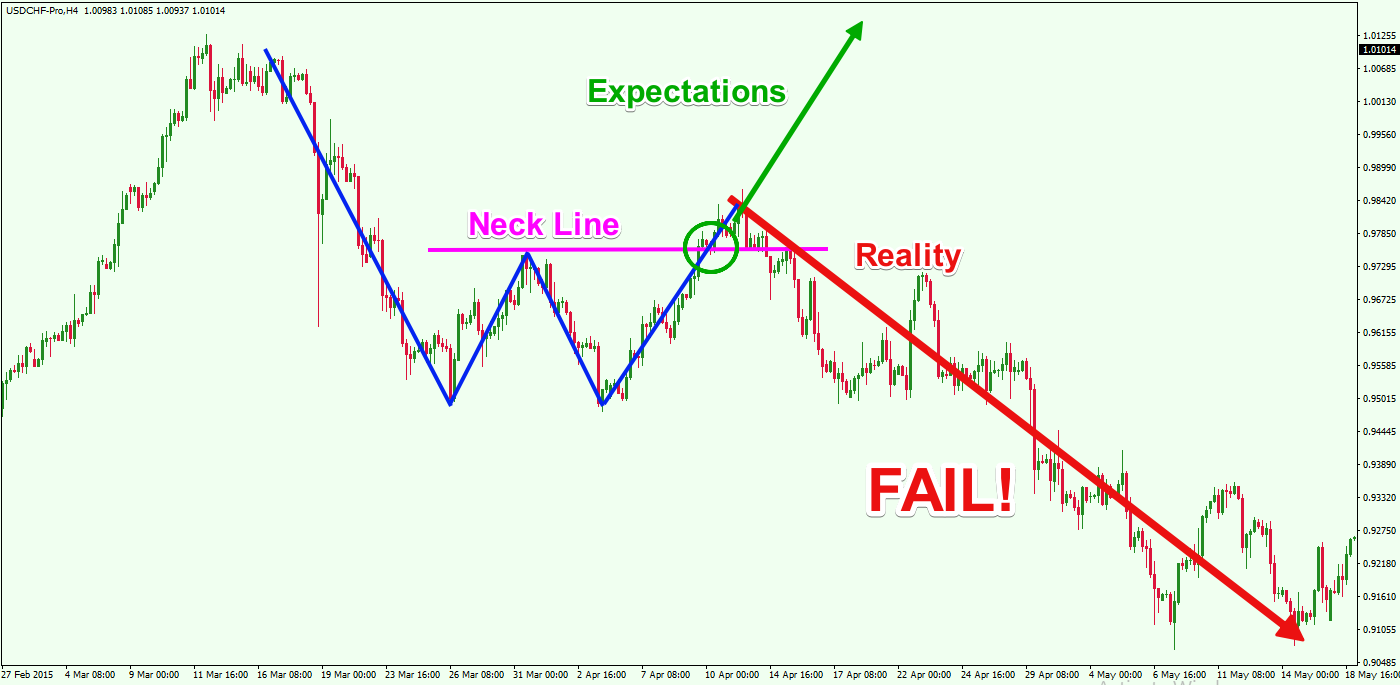
Ladies and gentlemen, this is a Double Bottom chart pattern as indicated by the W-shaped blue lines. The magenta-colored line forms the neck line of the chart pattern. That line acts as a confirmation signal to make a trade.
See how the price breaks the neck line in the green circle. Nobody hast to tell you that the bulls are taken over from the bears. Unfortunately the price action makes that dreaded unexpected U-Turn, triggering a bearish fight back. Consequetly traders will be taken unawares by this sudden turn of events. No to mention the fact that they will be forced to activate their stop loss orders.
Your ability to grasp why chart pattern chaos occurs on the charts is absolutely crucial if you want to profit from their collapse. The gospel truth is that chaotic patterns don’t just happen in a vacuum. There is something bigger at work. In some instances, one chaotic pattern transforms into a definite pattern. If you were paying attention you’d notice that the collapsed Double Top Pattern evolved into an Expanded Triangle.
Let’s take a look at the price action.
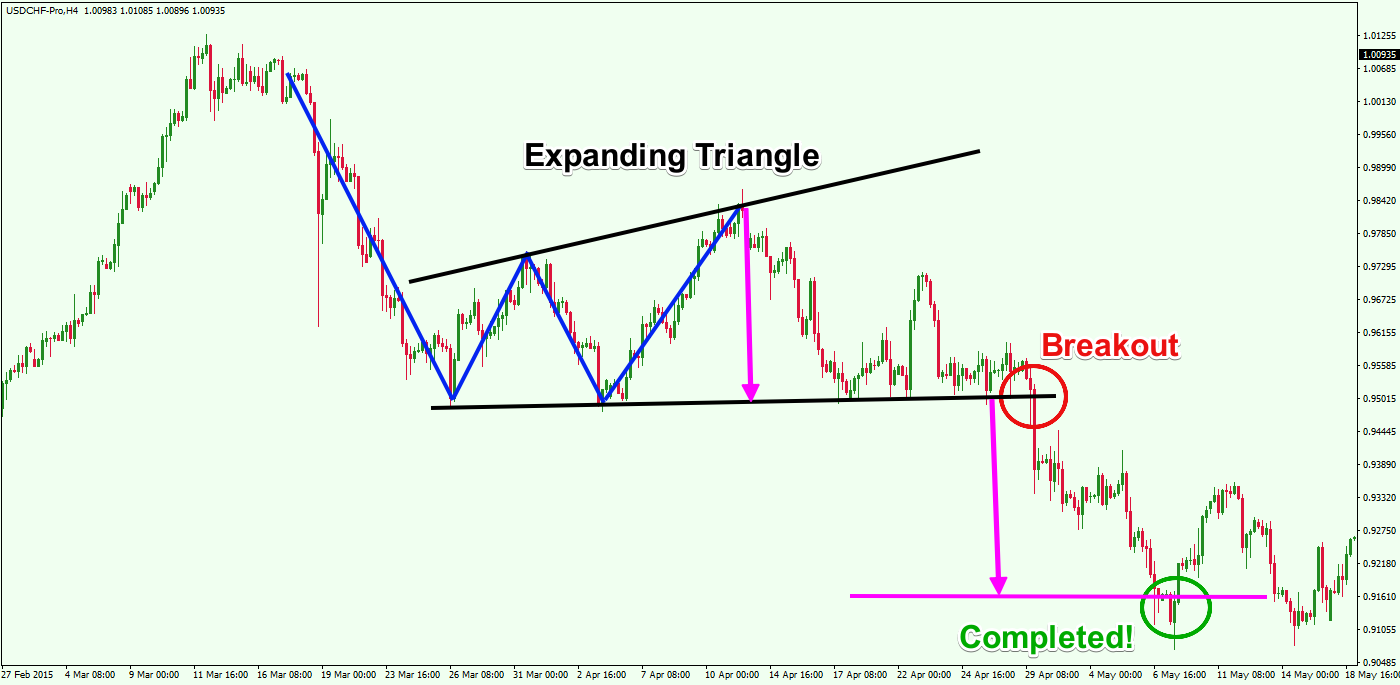
Now the upper and lower level of the Expanded Triangle represent the actual chart pattern. Sure the now to be decimated Double Top pattern(in blue) is the confirmation signal. But, like we stated earlier we see price turn out to create another bottom on the lower level.
If you are looking at the black horizontal support you should be saying”hmmm.. This area could come in handy in future.”Why?because when price breaches the lower side of the triangle, there is every reason to believe that a downward push by the bears is highly likely. And as you can obviously see, the triangle lives up to expectation after the bearish breakout.
Now the question on everybody’s mind is:
How Do I Enter A Chaotic Pattern Trade?
First things first. Identify the point of collapse. Usually you should spot a weak break and cut through, then a quick return to the breakout point. Then the price action returns to the key level of the pattern backed by stronger momentum as compared to that of the initial breakout. And when this happens you have a chaotic chart setup.
The long and short is make your entry only when price action breaks out and closes beyond the original breakout but only in the opposite direction
Next up is:
How Do I Place My Stop Loss In A Chaotic Pattern?
Just place your stop loss at the key level, previously used as the trigger for the previous chart pattern before it collapsed.
How Do I Take Profit In The Midst of Chaos?
First off, check whether the price action will transform in to another pattern. If that takes places then you simply follow the take profit rules for that pattern. However if the failed pattern remains the same, then do yourself a favor and quietly make your exit.
When the previous collapsed pattern remains the , you then apply price action analysis to make your exit. Patterns such as channel breakouts, ascending triangle patterns, candlestick patterns. e.t.c. come to mind. However, when the currency starts stalling, be on the lookout for possible reversal signals. Also keep a close eye on swing highs and lows for fire exit opportunities.
Now let’s take a look at an illustration of both the stop loss and take profit using the USDCHF pair
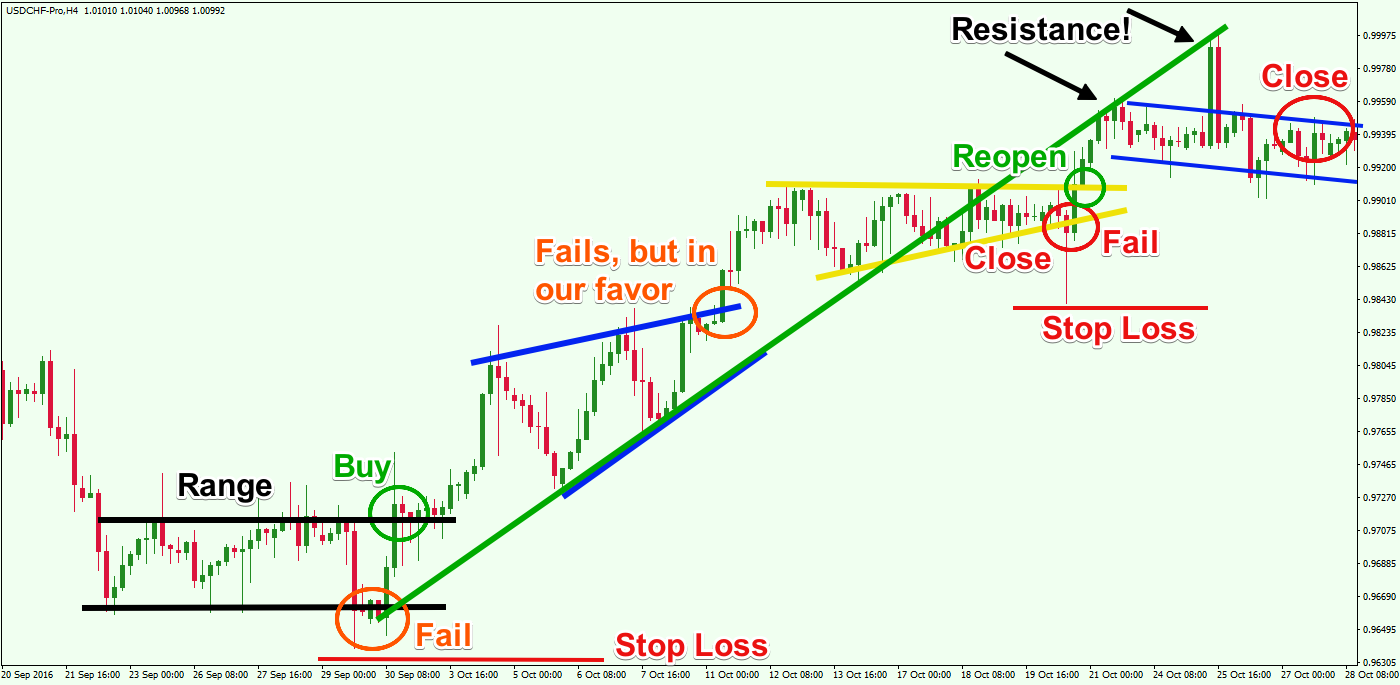
Ladies and gentlemen here is an H4 chart featuring the USDCHF pair. This is a classic example of how to take advantage of chaotic patterns and make amazing profits from the carnage.
The image begins with a tight range , a consequence of a price drop. The range is represented by the black lines. Then out of nowhere the range breaks through the lower level, tricking everybody into believing that the bears will kickstart a bearish trend. Boy are people going to have egg thrown all over their faces. Because three periods later, the CHF slips back into the black channel through the upper level, backed by strong momentum. Ironically this false impression creates a high probability signal after the USDCHF pair fail to breach the lower level.
You can place your buy order as indicated by the green circle. You then place your stop loss below the lowest part of the range. The stop loss area is indicated by the red horizontal line below the lower part of the range. The ranges crashes the confirmation area but collapses. It then does a u-U-Turn or makes a reverse.
The bulls then take over to start their bullish trend. see how the CHF creates a Rising Wedge pattern in the process. This will be great news for the bears as the Rising Wedge is know to have a strong bearish disposition. Head for the exits the moment the price action breaks down the Rising Wedge. Expect a trendline breakout to coincide with the wedge breakout as well.
There is extreme disappointment among everybody as the Rising Wedge fails to break out of the downside as everybody anticipated. This pattern failure should favor the bulls as they are now in a strong position to rack up the profits. With that in mind the bulls take full advantage of their new found strength as they climb up the hills. Of course this creates a strong bullish run.
However, the Rising Wedge pulls a fast one on everybody when it fails to penetrate the downside. The silver lining in all of this is that the Rising Wedge’s failure does not create confirmation of a bearish takeover. So there is need to close the trade. This is what you’d call a non-confirmed pattern because the bulls are still in control of the bullish trend.
The bulls then resume their trend after the brief rejection. Buoyed by the non-confirmation information, price then creates a huge bullish push, creating an Ascending Triangle(as indicated by the yellow lines. With this new found momentum, the ascending triangle breaks the trend line from the side.
At this point in time, don’t be in a hurry to close the trade. Instead keep your cool until the yellow triangle pushes downward. That will be your queue to head for the exit.
Almost immediately, price action what looks like another 360 by trying to push upwards. Unfortunately price is unable to push through the trend line, signalling the end of the bulls’ advance. Even worse, the bears takeover at the end of the chart is your queue to exit with your cash pronto!
So basically the graphic shows three chaotic patterns. Two of these patterns were confirmed but eventually fizzled out, One of these non-confirmed patterns also helped us recognize the potential direction of the trend.
For more information on trading patterns, look up How To Trade Chart Patterns Like a Sniffer Dog Parts I and II
That’s a wrap for “How To Trade and profit from Forex Chart Pattern Chaos ” Some like to call it failed patterns as well. Basically these patterns look like profit potential but end up costing you profits by doing a complete reverse.
But luckily you can trade and profit from the chaos. All you have to do is identify the origins of the chaos and then enter the market when you spot a breakout at a key level in the opposite direction of the trend.
Till next time take care.
Open Live Forex Trading Account
If you’re looking to open a live forex trading account Sign Up With EasyMarkets
