Hello and welcome to another edition of the bulls vs the bears. In my last post Wide Stop Losses – Absolutely Crucial For High Probability Trade Success I mentioned in passing an indicator called the Average True Indicator(ATR for short). Today we are going to learn how to use the Average True Indicator to boost your rep as a forex trader
I guess the first question we should ask is
What Is the Average True Range?
Well the Average True Range is a single line indicator that measures the volatility of a currency pair or market. The Average True Range indicator was originally invented by a gentleman by the name of J. Welles Wilder to measure the volatility of commodities in the futures market. I guess folks in the forex market saw it fit to apply this indicator to enhance their profits. If you think the ATR measures price trends or price direction like Moving Averages Conversion Indicator(MACD), think again. The ATR measures when volatility is high and when volatility is low. If you wanna learn about Moving Averages, look up Moving Averages Part I and II
Let’s look at a price action illustration of the ATR using the USD/CHF pair.
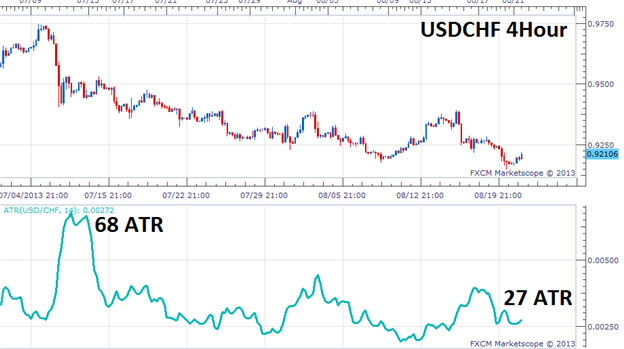
Now this is the ATR for the USD/CHF pair. The single line at the bottom of your trading window is the ATR. This line measures the fluctuation of the forex market. The high peaks suggests high market volatility. The ATR measures this fluctuation within a specific time frame. So as you can see, the ATR time measured the forex market volatility between April 4th to August 19th 2013. 68 ATR indicates high market volatility whereas 24 ATR suggests low market volatility. We’ll explain that in detail
If you’re looking to use the ATR to determine your entry and exit points, you are absolutely on point. When volatility is high, markets move at the speed of light. n However.when market is low, it suggests low volatility and that the market is in consolidation mode.
The ATR is also useful for traders who are addicted to getting a blow-by-blow gauge of the current level of market volatility. For those of you who like to anticipate potential price breakouts, the ATR is the perfect tool to use. Please be aware that forex markets move from periods of high volatility to low volatility and back again regularly. Thus it makes common sense to use the ATR to measure the ebb and flow within the forex market.
I guess the appropriate question to ask is
How Do I calculate the Average True Range?
Well, to calculate the average true range a specific period you need to identify the True Range of the specific period on the price chart.
Now how do we find The True Range? Well,you need to do three calculations and pick the one that gives the highest value:
- (Current Period High) – (Current Period Low)
- (Current Period High Absolute Value) – (Close of Previous Period)
- (Current Period Low Absolute Value) – (Close of Previous Period)
The highest figure from these three formulas is your actual True Range. Once you get the True Range, just average the values for the period on the chart
Now Some of you are probably thinking “Whew!This is complicated.” Well I have a solution. Make sure your trading platform offers the ATR as a tool such that the ATR calculates these values automatically. This way you don’t have to worry about crunching these figures by yourself. So long as you understand how the ATR works, that’s half the job done. The rest is gravy.
The default Average True Range formula uses a 14 day period EMA indicator. However, you can always manually adjust the period to suit the time frame you’re looking at. So if you’re looking at a 10 day period, you simply change the period from 10 to 14. I’ll explain in depth later in the post.
ATR Useful For Setting Stop Loss and Take Profits
We’ve already established that ATR tells you when volatility is high and when volatility is low. Now you’re going to love what I’m about to say. You can also use the ATR to set your wide stop loss based on prevailing market conditions. Not only that, but the ATR helps you avoid strangling your trades with tight stops in high volatility periods and wide stops in low volatility periods.
If you are passionate about high probability trades, you should be able to make a killing with the help of the ATR. The ATR will most certainly help you set high probability take profit points. If the ATR records a fairly high reading you’ be crazy not to stat in the trade for a biger profit target. Your expectation should be that the high market volatility will lead to a humongous price adjustment. Now let’s take a look at such a scenario using the EUR/USD pair.
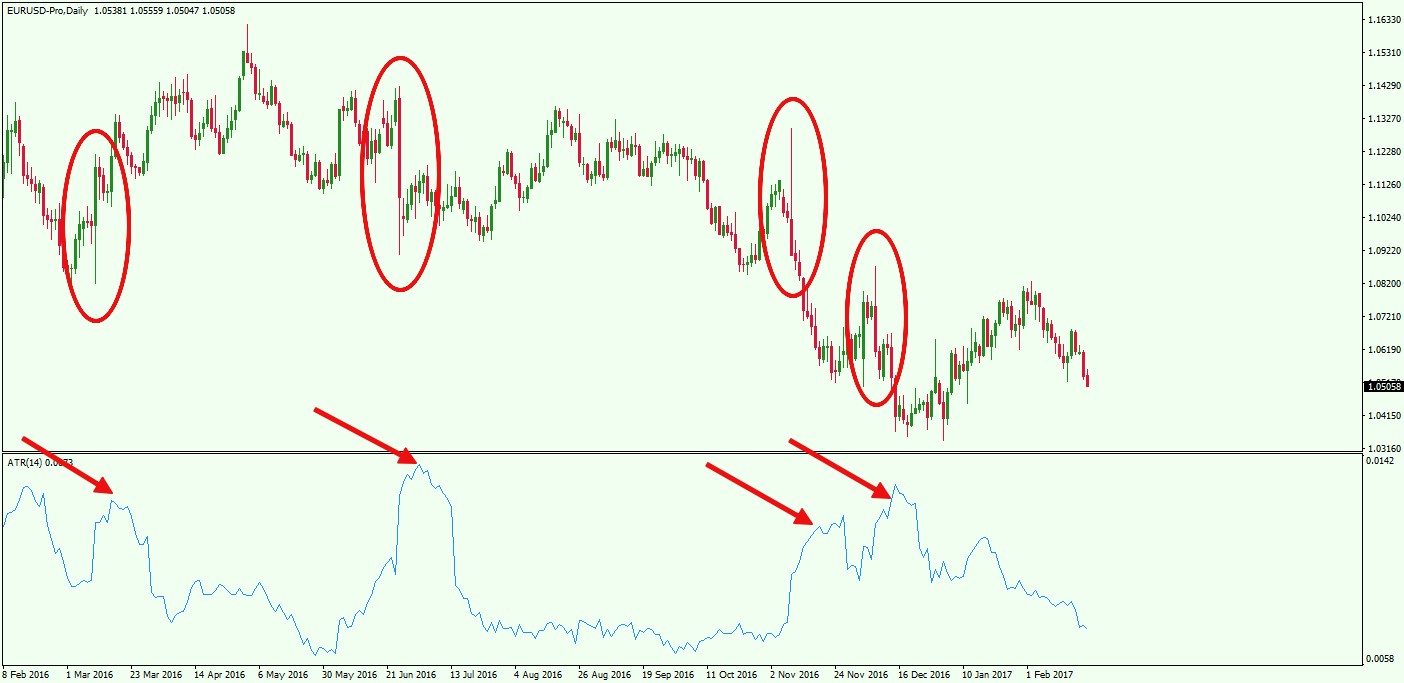
Here is the price action chart for the EUR/USD pair for the February 2016 – 2017. Now as you can see the ATR is etched below the price chart . Now the red arrows pointing at the high peaks of the ATR indicate point to periods of high values associated with high volatility in the market. Now some of you are probably wondering “/what are those humongous candles in the price chart circled in red?” Well those candlesticks are formed at the corresponding times indicated on the ATR.
But remember this. When the ATR readings start stumbling, it means the market is taking a breather. By taking a breather it means the market is very quiet. In plain forex speak, the market is recording low values associated with low volatility. The bulls and the candlesticks are usually smaller, and price action is as quiet as a cemetery. And when you have these two issues. , it means the market is in consolidation mode or moving sideways. In other words the bulls and the bears are taking a breather to plan their next move.This is where your tight stop losses come into play. While they plan their next move, just set small realistic profit targets. After all, the players are taken a breather, which means there will be little movement from price.
The ATR can can also help you predict future events in the forex market. If your crystal ball spots the ATR slowly climbing upwards you can be sure that market volatility will stay on the high side. However, be prepared for a change in market behavior in case the market transitions from high to low or low to high.
ATR On MT4 Platform
The ATR is nicely placed in your Metatrader 4 platform. Now some of you are wondering”How Do I activate The MT4 ATR Indicator?” Well got to “Insert” and choose “Average True Range. You should see the default 14 day Exponential Moving Average.
I’m sure some of you are thinking”But what if I want to change the 14 day period to something else?” Sure you can do that. Just select”ATR Moving Properties” and you will see the following popup window as shown below.
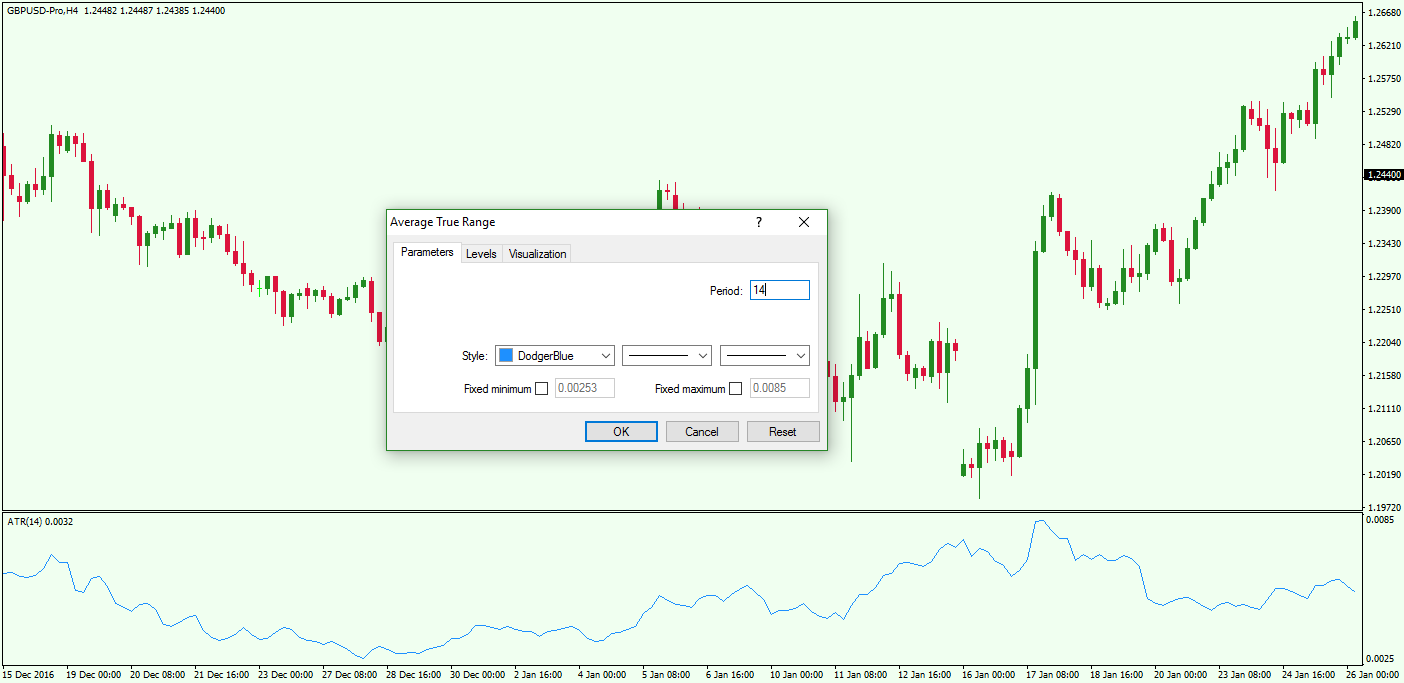
Now do you see the “Period” field under the “Parameters” tab? Just change the ’14’ value to the setting of your choice. Your new setting will reflect instantly. To learn how to trade on the MT4, look up Metatrader I and Metatrader II
Something You Need To Know About Average True Range
Yes, we all know that the Average True Range is used for measuring market volatility. But there is something you need to know about ATR. You can’t use The Average True Range in isolation. You should use ATR together with your trading plan, your trade entry, stop loss placement and profit target(or take profit entry). We’ll be discussing these three in detail
The ATR is also better served when it’s included with price action analysis and a Trailing Stop Loss Order based on an ATR value. If you are looking for entry signals price action patterns are the best place look. Looking for examples of price action patterns? How about candlestick patterns, trend lines, trend channels?e.t.c
Now onto our full length discussion starting with
Stop Loss Placement
Once you enter your trade, you place your trailing stop with the help of your ATR. The logic here is to ascertain the distance you want to trail the price. Once the price action moves in your favor, the stop loss will tag along with price according to the distance you’ve set for the current price.
But if the price kicks against your trade, the Trail Stop will stand in attention like a statue. It will not move an inch. In light of this, the Trailing Stop acts as a wide stop when the price moves in favor of your trade. This allows you to stay in the trade longer and make maximum profit as the trend persists.
So basically the rule for using a Trailing Stop with respect to the ATR goes like this. If the line representing the ATR Indicator is in the upper half of the area, you put a wide stop loss order in the market. But if the ATR indicator records a value in the lower half of the area, that’s when you employ a tight stop loss.Why, because market volatility is lower at that time. Meaning, the bulls and the bears have taken a break. Let’s look at an example

The blue ATR upward lin suggests a high ATR. In . And when that happens you place your Trailing Stop on the large dark blue candle as indicated by the top arrow. If the market volatility were lower, you’d have had to place a tight stop since the market is in consolidation mode. So the bigger the candlesticks, the higher the market volatility. And the smaller the candlesticks, the lower the market volatility.
Next Up Is
Setting Profit Target
If the ATR in the upper half of the indicator, multiply your pattern by two. This means your target will be twice the normal size of the pattern. Once your trade hits the bigger target, you gently exit your trade. You’ll be doing your trading account a huge favor.
However, if the ATR line strays into the lower half of the indicator you set your profit target at the minimum potential of the trend pattern. But if the line is still in the lower half of the indicator, the bulls are still moving upward, you can still double your profit target. So the same idea applies whether the line is trending up or down.
Let’s say the bulls help the price of the EUR/USD break through a triangle pattern. You decide to buy this pair expecting that price will spike up. Now The triangle pattern trading rules require to stay in the trade for a minimum price move equal to the size of the trading pattern. However, if you happen to spot high ATR values you may want to stick around and watch the price increase to twice the size of the triangle pattern. Another option would be to exit half of your trading position on your original profit target, and then close the other half of the trade at the second profit target.
Now let’s look at an illustration using the GBP/USD pair
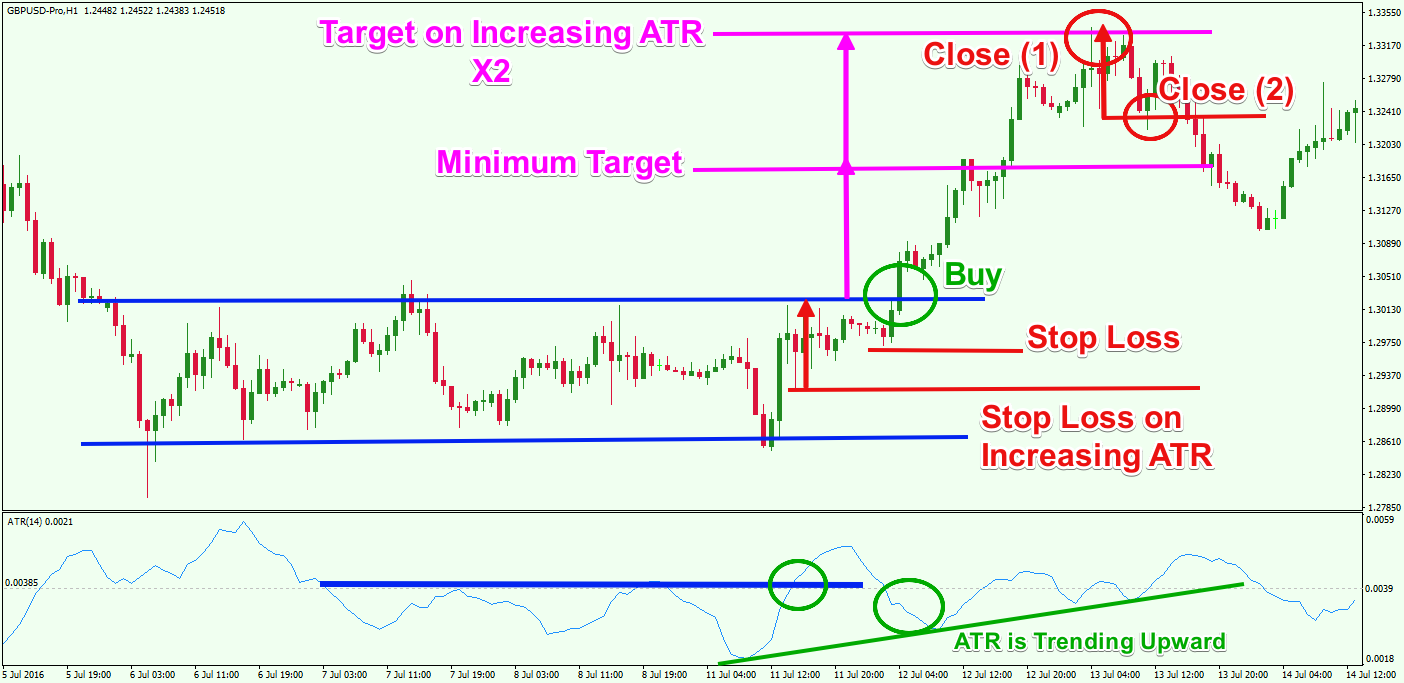
Here, ladies and gentlemen is the H1 (1Hr)chart for the GBP pair for July 5-14 2016. As you can see a long trade opens up when the bulls break through the upper level. Notice how the middle of the ATR indicator(green in color) has been marked to merge the upper and lower part of the indicator.
The blue horizontal lines on the price chart represent the range of the GBP/USD pair. While the blue horizontal lines of the ATR area shows the ATR line in mid stream.
Now take a close look at the ATR line breach the middle level and set up shop in the upper section o the ATR indicator. Now see the price breach the range through the upper level and creating a long price signal in the process. At this time the ATR line is in the lower half of the ATR indicator. In that case,you put in a Buy Order(Green color) on the premise that you will pursue the minimum target of the pattern equal to the size of the range(As indicated in purple).
As we climb up, we see that the ATR line is also climbing(See below the price chart). Simultaneously we see this same line move into the upper section of the ATR indicator a few times. You don’t need to be a rocket scientist to conclude that the volatility for GBP/USD pair is on the increase. So you exercise the option to increase your profit target at twice the size of the triangle pattern. You then adjust your Trailng Stop as illustrated on the price chart. Once you have adjusted Your Trailing Stop you can now afford to hold your trade until price reaches twice the size of the range, as indicated by the two magenta lines at the upper level.
Let me explain a few happenings in the price action.The first red arrow shows the distance between new Trailing Stop and the entry price. Once the 2x target is hit, GBU/USD takes a tumble.The second arrow at the end of the chart shows the moment the price hits the Trailing Stop when the trade has not been closed.
Let’s take a look at another price action illustration of the ATR Trailing Stop at work using the same EUR.USD pair.this time we’ll be working with a bearish channel
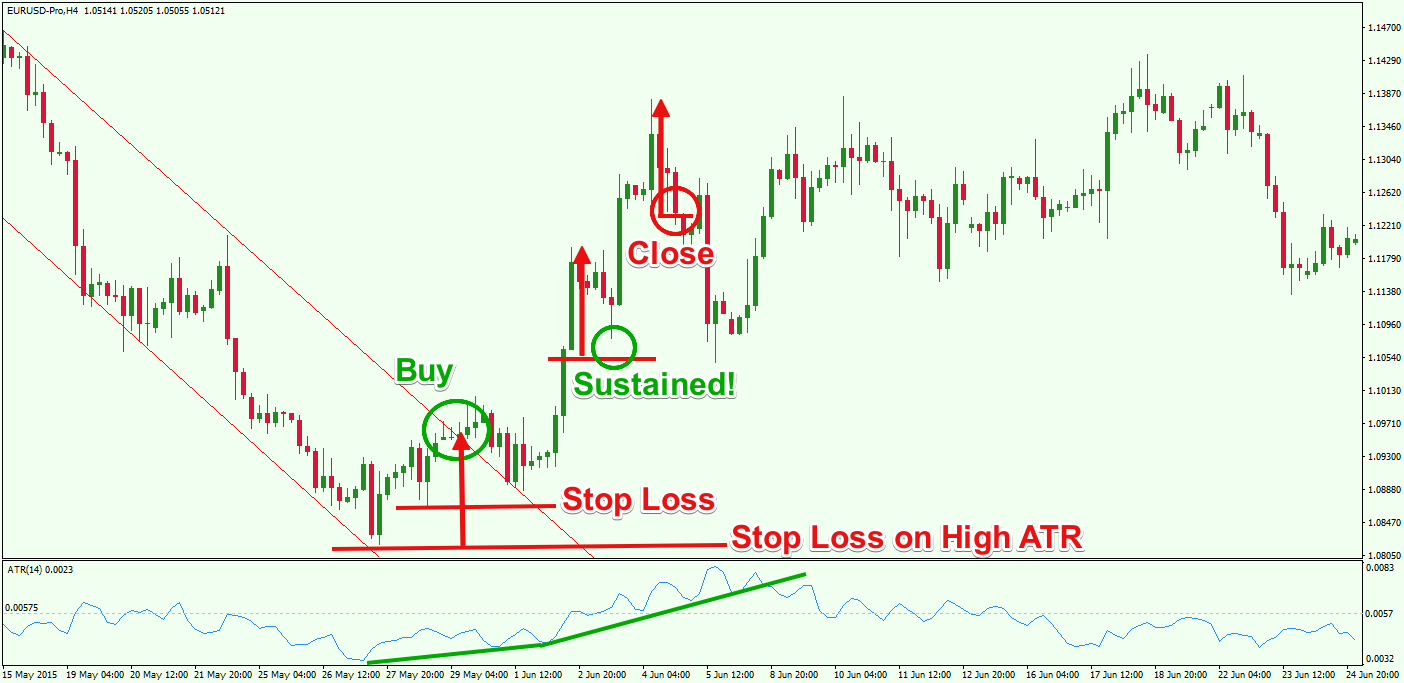
Ladies and gentlemen, I present to you the H4(4hr) chart for the EUR/USD pair from May-June 2015 using the ATR Trailing Stop.
As you can see, a bearish channel kicks off things on the price chart. Notice how price of the EUR/USD breaches the bearish channel through the upper level during low volatility. Remember when I said you could place a Buy order during low volatility even if the line is trending upwards? Well this scenario is a classic illustration. At this point place a Buy Order(labelled Green) and place a Trailing Stop Loss on the previous bottom swing as indicated on the chart.
Also see how price takes another crack at an already compromised upper channel. In this situation d you adjust the distance of the Trailing Stop to better absorb the market volatility. You can also measure the distance between the breakout point and the low of the previous channel which then becomes the new pip distance for your new Trailing Stop. You’d be better off settling at 140 pips.
See how the bulls finally hit the Trailing Stop after a couple of strong sorties? After the first sortie, price nearly strikes the Trailing Stop after a slight adjustment (as indicated by the red arrows). But this time The Stop Loss stands ready to absorb whatever price throws at it. Had you not adjusted the distance of the Trailing Stop, your stop would have taken a massive hit, and you would have missed the next bullish sortie. Unfortunately, after the second bullish sortie, the Trailing Stop takes an uppercut from price once the bulls and bears go into consolidation mode. It’s obvious they’re tired from absorbing each other’s jabs. They need a break.
Triangle channel trades usually have no specific rules. As such, the Trailing Stop becomes your best friend in such complicated times. The Trailing Stop becomes even more useful when deciding to exit half of your profit target instead of the full target. Just be sure to widen and tighten your ATR Trailing Stop depending on values showing on the ATR indicator
That’s a wrap for ”How To Use The Average True Range Indicator To Boost Your Forex Profits”. As you can see the ATR is very helpful in placing your stop losses and profit targets. If anything it will save you a whole lot of headaches as far gauging the stability of the market. You don’t need to crunch calculations as how to ascertain your ATR. Your MT4 platform will take of that at the backend for you. But f you think you are smart enough to crunch these calculations by your self, you’re welcome to try.
Now if you wanna learn how to set stops, take profits, buy orders and other market orders, look up Forex Trading Basics Part I and Part II
So til next time take care.
Open Live Forex Trading Account
If you’re looking to open a live trading account Sign Up With EasyMarkets