Hi people
A few days ago, we tried to learn How To Trade Price Action Without The Indicators. Let’s recap what we learnt:
- Read The Price Chart
- Identify The Trend
- Spotting The Range Market
This week we are going to continue with “How To Trade Price Action Free of Indicators Part II.” Now I thought long and hard about doing Part II next week. But I didn’t want you guys screaming in my ears saying”WHY ARE YOU LEAVING US HANGING IN SUSPENSE LIKE THIS?” Well, I guess it’s better to speed up momentum than to slow it down. We don’t want you starving for too long. Do we?
So onward:
Be On The Lookout For Probable Turning Points
If you want to be a successful price action trader , then you need to be constantly on the lookout for probable turning points. By that you need to spot the most likely areas prices are going to do a U-turn or reversal.
Although a lot of people use tools such as Fibonacci levels, pivot points,e.t.c. I prefer to get back to basics using support and resistance levels and trend lines. I guess most people prefer to stick to basics rather than complicate things with th Fibonacci’s of this world. Let me show you a few price action illustrations
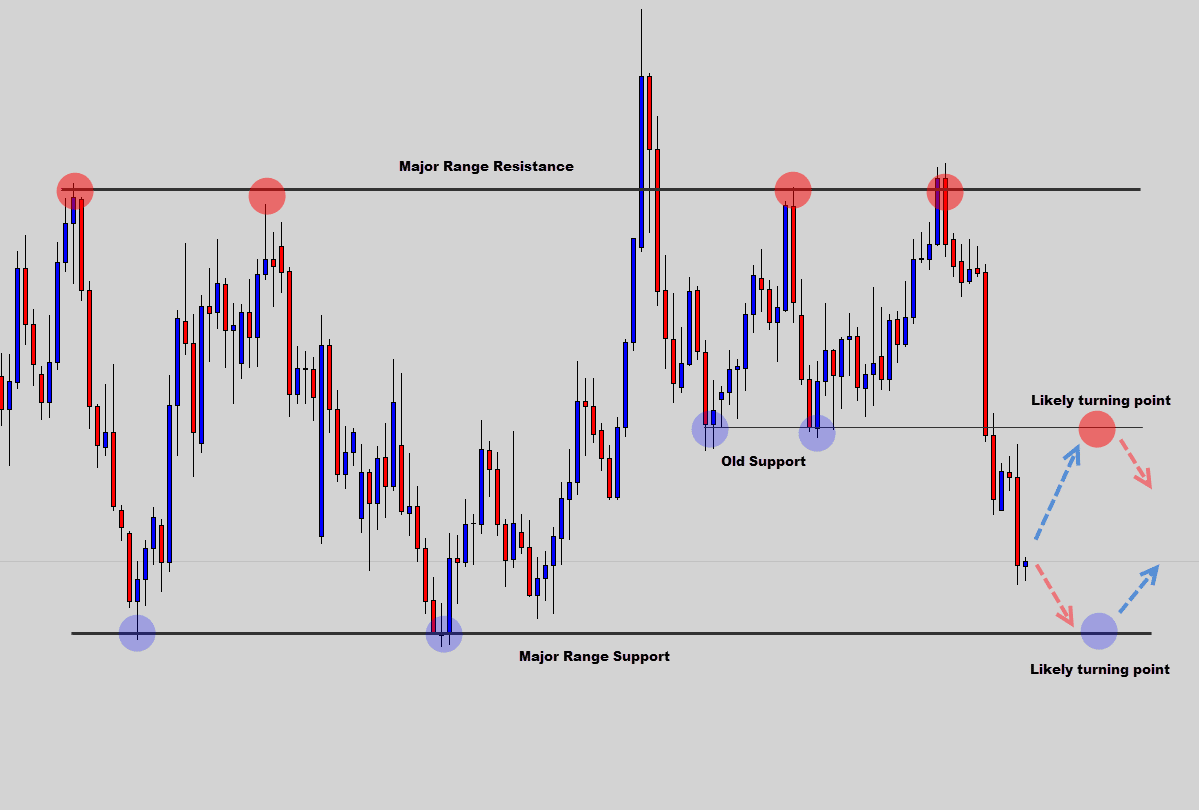
See the initial support level is set up at the bottom of the chart and the old support level support further up. The resistance level is also setting up shop at the very top.
Two scenarios are unfolding here. First, price pulls back a the old support level and converts the old support into a new resistance level resulting to a price reversal at that level. Second, the bears continue to sell off as the bears charge towards the major range support level. At the very least price may bounce of or ricochet off the support barrier.
Now let’s take a look at how trends are utilized highlighting potential reversals.
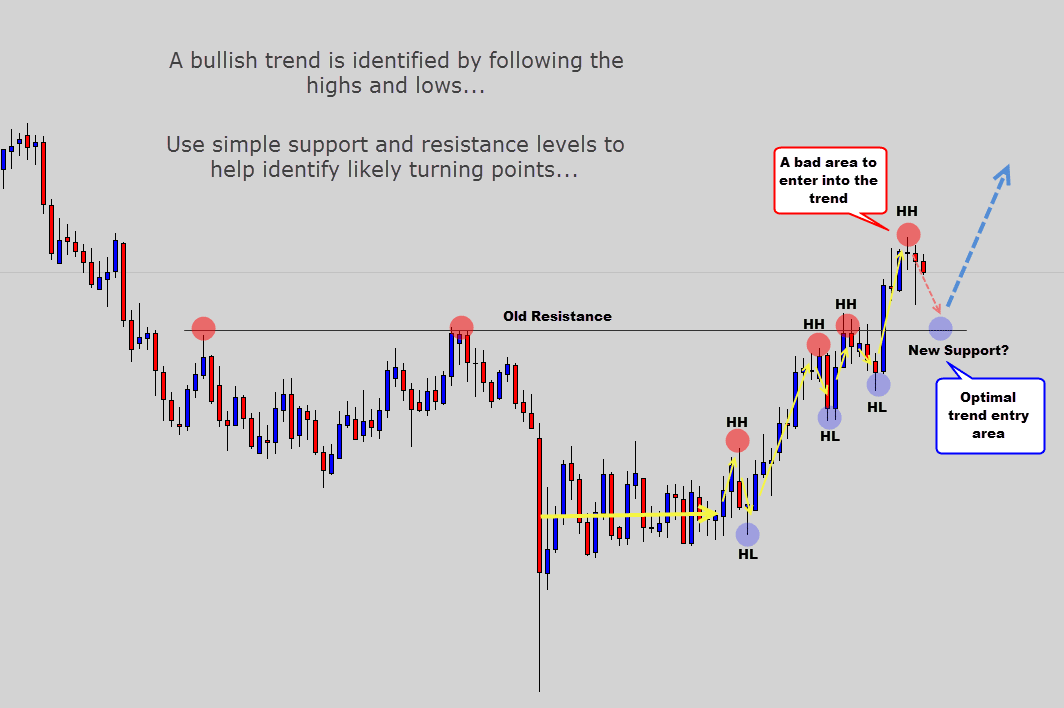
This is a classic illustration of how sticking to basic chart analysis can really help you perfect your chart reading skills. You can see the uptrend nicely lined up with the HL and HH levels neatly decked out. Also keep an eye on the resistance and support levels and the probable bearish reversals in those areas. When the reversal occurs, it can only mean one thing – a bearish slalom run and an opportunity to sell..
You can also tell that the bulls are in a bad place as indicated by the rounded box at the top. This is how a lot of traders easily get baited. Their mentality is “As long as the bulls are still on the rise let’s jump straight in.'” Well as you can see,the bulls have run out of steam at the top. You only jump in when the bulls are strong.Make sure the candlesticks are full and upright.. If you do otherwise, you risk buying out of position and losing a lot of money in the process.
We can also tell that price is about to pull back and convert into lows. Remember when I said “Buy low sell high” in last week’s lesson? This where you make use of that adage. Basically you use the trend’s retracements to your advantage and enter the market at a smart price.
But there are times when support and resistance levels can drive you up the wall. Especially when you have to wait and wait until you get confirmation. So to cut out all that anxiety, just employ the services of a trend line. And make sure you don’t get carried away with the trend line because you may end up forcing trades that don’t exit. Let’s see how the trend line is used.
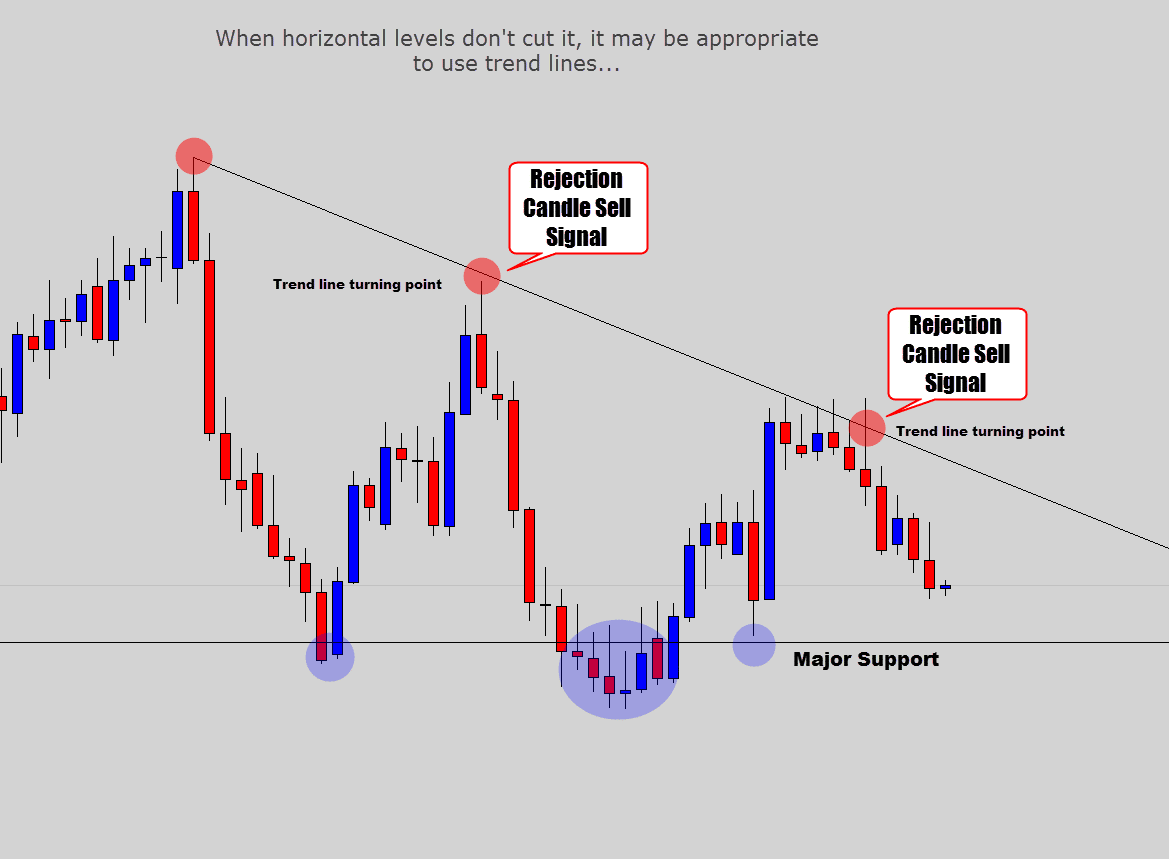
As you can see, the trend line helped ascertain the bears annual slalom or bearish downtrend. The constant pattern of LH(lower highs) recording LL(lowerlows) illustrates the bears downward spiral. We see a few price signals alright, but they ended up being ‘unlucrative trades.” In other words, they are not profitable-as indicated by rejection label.
The long and the short of this illustration is just make sure you are not caught in the middle of nowhere in this scenario.Keep your eye on the likely turning points and use the support/resistance tools to mark out the most likely areas for price reversals or bounces,as they call them.
If you want to strengthen your suppor/resistance knowledge catch up with Identify Support/Resistance with Price Action Analysis
Wait For The Signal
Wait for the trade signal. It’s that simple. Ever heard of the situation where an undercover cop waits for the signal of his partner when the coast is clear? It’s almost along the same lines where price action trading is concerned. You’re waiting for your chart to signal you of a probable price reversal.
And the most common price signal is the pinbar rejection candle. Now the rejection candle is price action’s equivalent of a message alert. And it’s the best tool for learning how to trade without indicators. Now let’s tie in everything we’ve learnt so far using the rejection candle as an illustration,starting with the chart layout
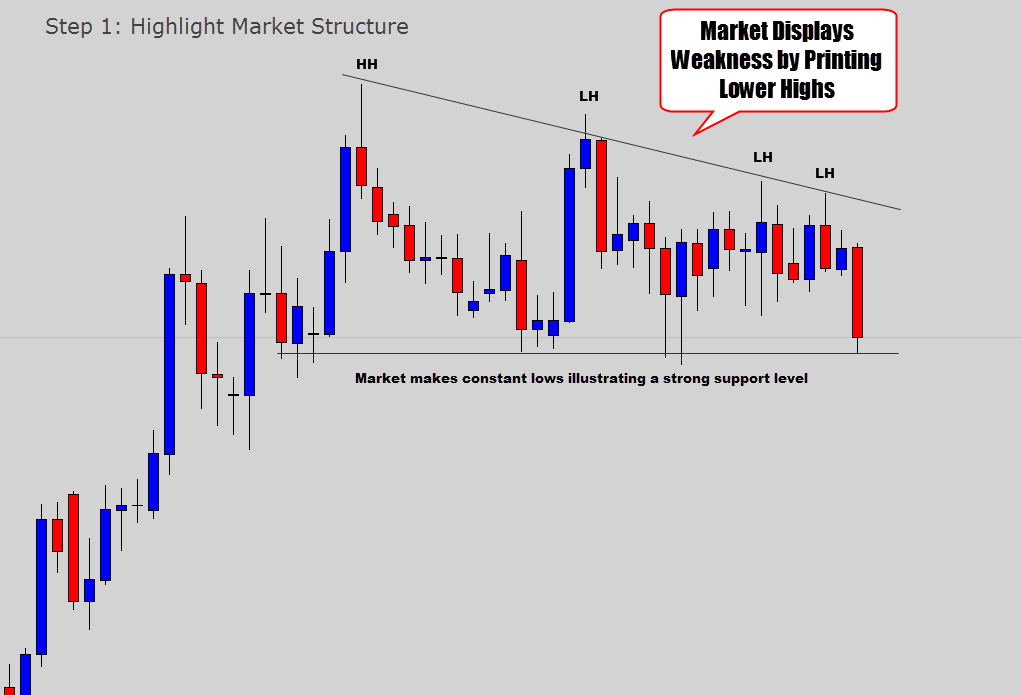
We see LH and LL as suggested by the bearish trend line. However, the market is in consolidation. In other words, the bulls and the bears are taking a breather and considering their next move. You’d be suicidal to enter a trade in a consolidation situation. So your best is to wait for a breakout before making your next move.
Once a breakout takes and more positive action occurs on the chart, we move on to to our next graphic for spotting probable trading points.
If you want to introduce yourself to trading breakouts read up on Break Out Trading Breakouts
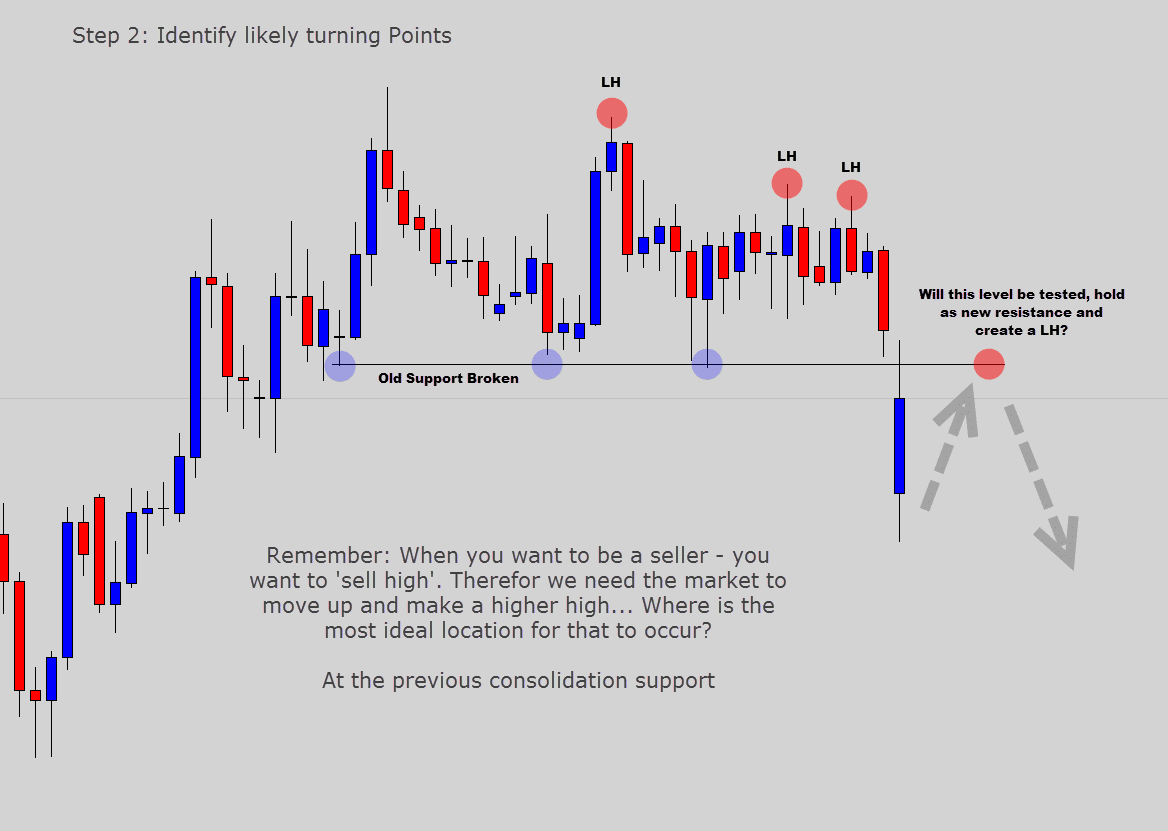
Remember the adage”Buy low and sell high”In this scenario, you most definitely want to sell high.But to do that, the market must move up to creat HH(higher high). And the most appropriate spot for that to happen is at the previous consolidation support.
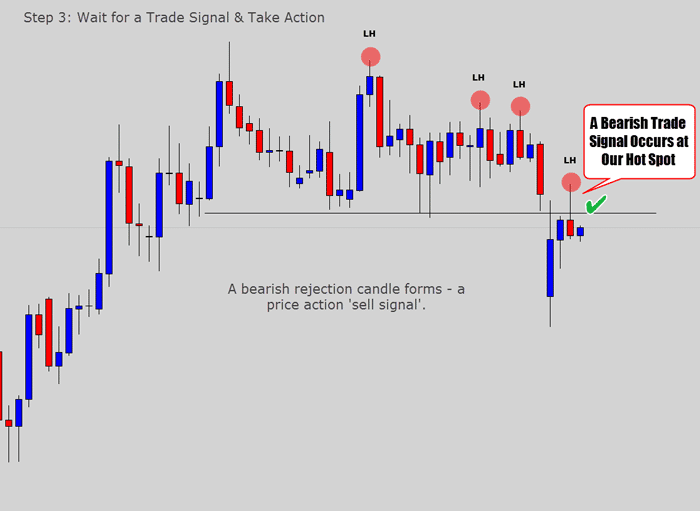
Voila! Here is the sell signal we’ve been waiting for – thanks to the rejection candle. After some excruciating patience and discipline, we;ve finally gotten the trading signal just where we want it. The key here is using your instincts. You do not want to think too much. Once the signal is lit, take steps to enter your trade.
That’s a wrap for ” How To Trade With Price Action Without The Indicators Part II” It’s been fun doing this exercise with you all. I hope by now you are convinced that trading with law price action and not the indicators is the way to go. Hopefully you’ll use these carefully laid out procedures to your advantage as far as profits go.
Til next time take care.
Open Live Trading Account
If you’re looking to open a live trading account Sign Up With EasyMarkets
