Remember when we tackled Identify Support and Resistance Levels Using Price Action Analysis? This week we’re going to learn how to locate dynamic support and resistance levels. Well, dynamic support and resistance levels are what I call the supersonic siblings of the static support and resistance levels that we covered earlier. They reflect the constant change seen on breakouts of support and resistance levels at incredible speed.
Although static models such as pivot lines, trend lines and channels are useful for price action analysis, they don’t adjust themselves based on the market action. Dynamic support and resistance levels reflect that evolutionary change. They are able to self-adjust as price action changes.
So we’ll look at a couple of tools that are used to locate dynamic support and resistance assistance.
The first tool is:
Moving Averages
As you are well aware, moving averages calculate the average price of a currency pair over specific time frames. Ask most traders, and they’ll tell you that moving averages is their favorite indicator. Why? Because moving averages is a better reflector of the speed of light changes occurring on the market. With moving averages, you put in your order when price dips and touches the moving average.
Now since we’ve already covered moving averages on this blog, we’re not going into much detail. So for the rest of you if you want to refresh your knowledge on moving averages, or you’ve stumbled in here wanting to know about moving averages, check on We’re Moving Averages Part I and We Are Moving Averages Part II.
Let’s take a look at a 15 minute GBP/USD chart using the 50 EMA 
Looks like the 50 EMA is holding its own fairly well. Whenever it took a hit from the pair, it resisted strongly, forcing price to bounce back like a ping ball. Keep in mind that there is no such thing as a perfect bounce. There are times when price will miss the barrier a little bit before heading back in the trend.
There are also times when price will say “The heck with this. Let me just blast through the line altogether.” What you could do in this situation is that you set up two moving averages , and ONLY put in a buy order when price hits the middle of the space between the two moving averages.
Let’s take a look at the 15 minute GBP/USD chart, this time using the 10 and 20 EMA’s.
As you can see price climbs past the 10 EMA by a few pips. But then it proceeds to take a tumble afterwards. The whole idea is that moving averages should be treated as zones of interest just like the traditional support and resistance levels.
Why? Because that’s where the price action is. Thus, the middle space between moving averages could be considered a zone of support and resistance.
Which brings us to a burning question?
Can Moving Averages Be Penetrated?
Of Course Yes. Just like any other support and resistance level, moving averages can also break and fold. Let’s take another look at the 50 EMA on the the 15 minute GBP/USD chart.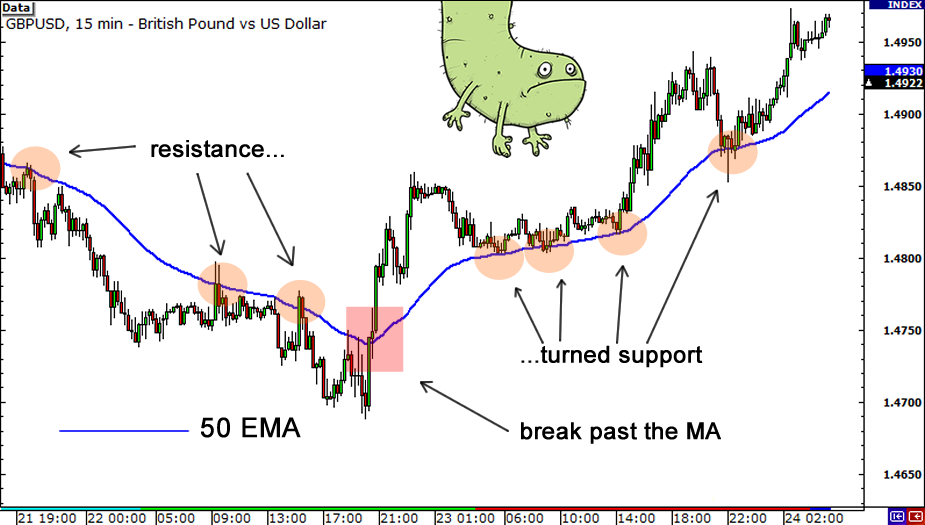
As you can see, the 50 EMA is holding firm as GBP/USD keeps ping ponging off the barrier. Unfortunately, repeated body punches sustained by the 50 EMA forces it to bend over, creating the escape the bulls need to head for the hills.
Price, feeling so confident all of a sudden pulls back and decides to hit the 50 EMA some more at the support level. Unfortunately for the bears, they run into a bulwark of a 50 EMA at the support level.
Because of the dynamic persona of moving averages, you don’t need to stare at your PC all day. Why? Because it’s always changing. All you have to do is apply a popular strategy known as“Set and Forget.: You set the moving averages on your screen and go grab a cold drink outside the house while the moving averages spot potential resistance and support trading zones. In other words, GO AND SMELL THE ROSES.
The next tool is
Price Channel
The price channel is another useful tool as far as dynamic support and resistance levels go. The price channel is similar to the traditional trend line, except that it has another trend line running parallel to it. So within the layout of the price channel, you have well defined limits for tops and bottoms.
I guess the first question we need to ask is:
How Do We Trade The Price Channel?
We first start by drawing a line on the chart. To do that we start by identifying a price in the price action where the tops and bottoms are moving with similar gusto. If your eyes are glued on the uptrend, you can draw a line through the tops and bottom.
Then draw another line parallel to the first line, which passes through the tops of the price action. If you are able to accomplish these two procedures, you have yourself a price channel.
Let’s take a look at how the price channel looks like on the USD/JPY chart

Here is a typical trend line drawn on a bullish trend. This bullish characteristic is confirmed by the lower level of the channel passing through the bottoms of the price action. Notice the upper level is parallel to the lower trend line, connecting the diagonal boundary where the price action takes place.
Let break this down to the bearest minimum. The lower level is the support level, while the upper level acts as the resistance level. The black arrows indicate the support and resistance actions on the price channel. See how price dips to the lower level of the channel and launches off the barrier like a ping ball? Next the price tries to reach out and touch the upper level of the price channel and does its ping balling routine there also.
Entry and Exit Trading Points
As you can see, channels are very useful for marking entry and exit trading points. When the price channel starts acting bullish, you look to make your trade once the price ricochets off the lower level.
Then hold your trade until the bulls reach out and touch the upper level of the channel. Once the price bounces off the upper level, you can choose trade the bearish move to the lower level. But I wouldn’t make that choice if I were you, since the price moves are relatively smaller than the general trend moves.
The Moment Price Breaks Out
At some point, the price channel ability to withstand the blows of the bulls is bound to give way. And when that happens, the price, aided by the bulls shoots for the mountains through the upper or lower level. It then ends its run with a strong closure at the lower level. Let’s see an illustration of the price channel breakout

As you can see, price initially stays in its lane. But then it suddenly breaks through the lower level (as indicated by the red circle). And here, the bearish influence is everywhere, as evidenced by the strong presence of the bears.
The bearish presence also accounts for the price’s dip in value. If you want to know more about price channels, look up We Are Going To Talk Channels.
Last but not least is:
Linear Regression Channel
Now the linear regression channel is similar to the price channel except that it has a middle line which is the median price value.
Now to avoid unforeseen collisions, the upper and lower levels are clearly distanced from the median line. You can also use this line to facilitate trades going in the direction of the prevailing trend. Let’s look at a pic of the USD/CHF pair

This, ladies and gentlemen is the Linear Regression Channel. Nicely lined are the upper level, lower level, and the median line. The black arrows points to price massaging the median line at both support and resistance.
But watch when price pierces the median level. It triggers a shift to the opposite channel line. The Linear Regression Channel is also useful for confirming trades, especially breakouts. Simultaneously, you can also use the median life to execute exits from trades.
If you want to know some more about trading the Linear Regression Channel look up Trading Linear Regression Channel. And if you really want to understand dynamic support and resistance levels, I suggest you read up on their static sibling Identify Support and Resistance Levels with Price Action Analysis
That’s a wrap for “How to Locate Dynamic Support and Resistance Levels ” As I said earlier, Dynamic and support resistance levels are a reflection of the speed of light changes occurring on the forex market.
Thanks to tools such as moving averages and price channels, you can better the capture the price changes,breakouts and other moves happening on the price chart. Next time we’ll tackle another exciting topic on the forex trade.
Til next time take care.
Open Live Forex Trading Account
If you’re looking to open a live trading account Sign Up With EasyMarkets
