Hello
Knowing how to identify support and resistance levels is absolutely key in price action analysis. It’s absolutely crucial if you want to succeed as a forex trader.If you are able to recognize these key levels, you will definitely seize the moment as a forex trader. If you find this aspect of price action analysis, too overwhelming, not to worry! One way or the other, you will learn how to identify support and resistance levels with price action analysis as your set of binoculars and profit from these key areas. But first:
What is Support and Resistance?
Well support and resistance are clearly labeled static zones on the forex chart, where the price of a currency pair is likely to come under pressure. Now why is that? This because support and resistance levels are psychological levels reflecting the intentions of the market players. Such that when price runs into such opposition, it either causes a ricochet(or bounce) in the opposite direction of the trend or initiates a consolidation(or downward slide of the price). Or, the level could also be breached, resulting in the price initiating a speedy surge.
You can also describe support and resistance levels as zones where the interests of market players collide.Think of this scenario as a tug of war where the bulls( being the buyers) and the bears(being the sellers) are jockeying for dominance in the market. The bulls are confident the price will go up, while the bears believe the price will go down. And so we have a major clash of the titans going on here. Those who come out victorious will have the advantage of pushing the forex pair in their direction. Now you see why I say identifying support and resistance is absolutely crucial in price action analysis?
Which brings us to the next question:
What is the Difference Between Support and Resistance?
Support is the level below the current price, while resistance above the current price. However, when price penetrates the support barrier, the support converts into resistance and vice versa. So when the level of a bearish direction is broken, the price relocates under this level, and the old support level now becomes a new area of resistance.
How about we take a look at the chart of the EUR/USD?
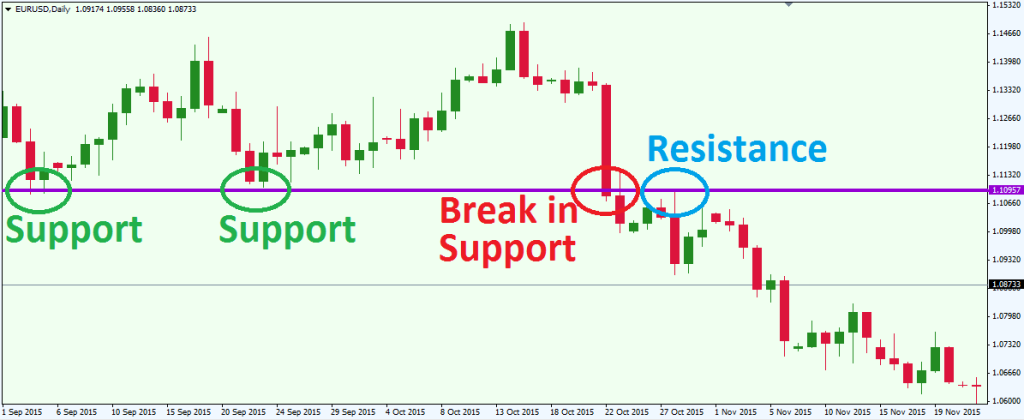
Now As you can see, the green circles shows the areas of support . While the red circles shows the price initiating a break in a bearish direction. However, the blue circle shows the price resist testing the new resistance level. This graphic also illustrates support level’’s ability to transition into a resistance and its influence as an opposing force.
So now that we’ve established the difference between support and resistance, I guess the next question is:
How Do We Find Support and Resistance Levels?
There is something you need to understand about finding support and resistance levels in price action analysis.Every bottom on the chart is potential support and every top is potential resistance. potential turns into reality when a price climbs up and down more than once. That is, if the price drops to a level and rises back, it’s considered an eventuality. So that when the market tries to breach that level it may run into a brick wall. But if the price bounces again from this level it’s confirmed a support. In that case the price is likely o repeat the bounce of the support in case the price drops again. This goes for resistance levels also.
But not all support and resistance zones have similar equilibrium. As a matter of fact, there are weak supports and weak resistances. In that case you’ll be better if you look for more reliable levels for smooth entry and exit points. Also make sure the support and resistance levels are older and have been able to hold up numerous times.
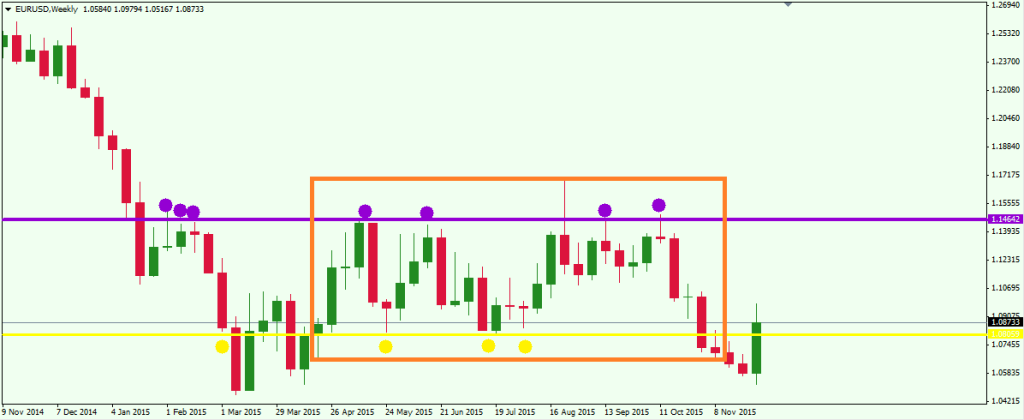
This picture here illustrates a stronger resistance versus a weaker support featuring the EUR/USD pair.The purple line represents the price’s resistance coming under severe pressure, while the dark line illustrates the line’s support. The circles show the exact areas where the level of resistance took a hit.
The purple line looks stronger since it’s a lot older and has absorbed countless hits.While the orange rectangle suggests consolidation of both levels with price bouncing back and forth as it struggles to break out of the range. But whenever you have consolidation of two levels with price bouncing back and forth , the price it struggles to break out of the range. Giving the price’s aggressive stance, it’s only a matter of time before one of the levels gives in. Since the purple line has a stronger resistance it follows the market’s bearish direction because the dark line support is bound to snap under the incessant pressure of the purple resistance. The price breaks through the dark support, and now turns into resistance as prices fall below the previous support level.
Now that we’ve learnt how to find support and resistance levels, it ‘ time to find out
How to Set Entry/Exit Points at Support and Resistance Levels
Setting entry and exit points are fundamentals every forex trader should know like the back of his hand. Why? Because all forex pairs have different support and resistance lines. So you need to keep a sharp eye on the price action happenings around these areas. If you can master support/resistance entry and exit points, you will have covered the fundamentals of your forex trading knowledge.
Now that we’ve gotten that out of the way, let’ get down to:
Setting Entry Points on Support/Resistance Levels
Let’s say a forex pair’s price approaches a tried and tested support zone. Since this support zone seems unbreachable, you will set an entry point once the price hits the support level. But first wait for the price to touch base with the support level. Once that happens, take a long position only if the price takes a bullish direction at this level. If you go long, the best place to place your stop loss is below the support area. Placing your stop loss below the support area will help you cut your losses n case the bounce turns out to be false and the support gets broken.
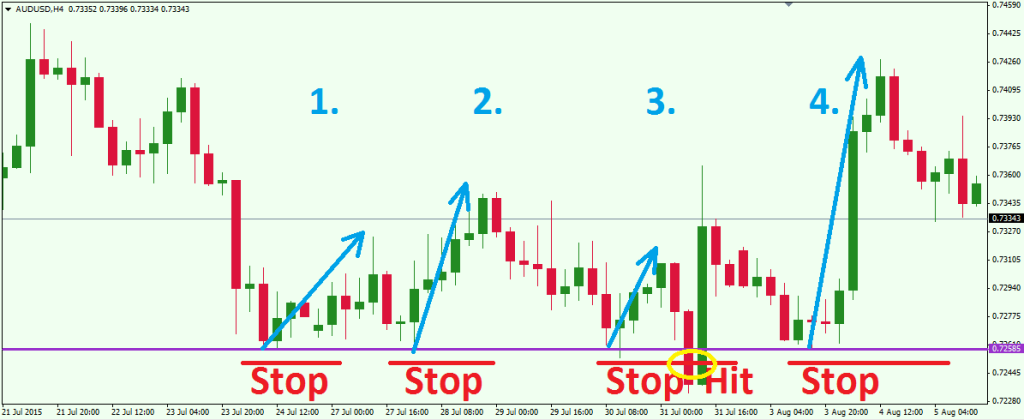
Let’s take a look at the AUD/USD graphic

The purple line looks established – a solid prerequisite for setting entry points.. The blue arrows illustrate the upward move after the price hits the support level. However, in scenario No. 3, the price takes a hit after a brief rise. You see why it’s important to put a stop loss when you trade? Also setting entry levels at support levels is no different from setting entry points at resistant levels. The principle is still the same.
Finally we come to
Setting Exit points at Support/Resistance Levels
Alright say you’ve bought a currency pair, thinking it might go bullish. Then suddenly a resistance area sets up shop along the uptrend, and you’ll like” Hmmmm…looks like the price might go bearish on me, and cost me a chunk of my money. Time to put some security in place.” This is where you put an exit point in place.
The USD/JPY graphic below should clarify things for you.
The thicker labels indicate the price hitting the support area. Along position is then established after the bullish pattern, indicated by the red line. Then the price gets acquainted with an established resistance, which as absorbed a few hits and stabilized the value of the Yen. This will be a good time to set an exit to avoid losing your hard-earned profits. Anytime the price hits the resistance, just slowly place a stop loss below the candle which tapped the resistance level.
Around the small faded line,if the price breaks into bullish mode, then you can choose to reopen your trading position. But if the price takes a huge hit, you’re covered with the stop loss that you placed earlier.
Which finally brings us to what you’ve been waiting for:
How Do We Trade Support and Resistance Levels?
Well there are two ways of trading support and resistance levels. The first one is:
The Bounce
In this scenario, you wait for confirmation that the support/resistance will hold before you enter your trade. Instead of just buying or selling straight away, wait for the price to bounce first before entering. You want to avoid a situation where price suddenly moves fast and breaks through the support and resistance levels. The last thing you want is to catch a falling knife Let’s take a look at both scenarios.


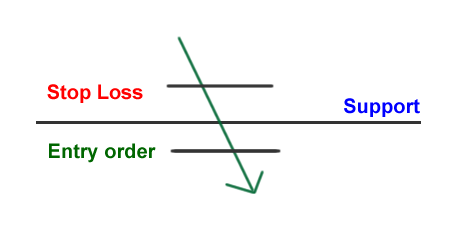
These two graphics show the bounce in action. in the support we have confirmation that the support level has been able to hold. So we can now place our entry order along the price level and our stop loss below the support level. The same situation goes for the resistance line also. Since we have confirmation that the resistance level has been able to hold, we can now place our entry order along the price line and then place our stop loss just above the price line.
Which brings us to our second support/resistance trading strategy:
The Break
Now ideally we’d love our support and resistance levels to hold till infinity. But it doesn’t always work out that way. At some point both levels ae bound to cave in.This is where the break comes to the rescue. There are two ways of trading breaks – The aggressive way and the conservative way. Lets first start with
a)The Aggressive way -To play the break, make sure the price slices through the support/resistance zone with ease. You only want to enter when a price passes through these two zones with such conviction that you’re left in no doubt that you can enter your trade.
As you can see from this graphic, the price has sliced through the support barrier without much opposition. So it’s safe to place your entry order.
Which mow brings us to:
b) The Conservative Way – This alternative requires a bit of patience especially after you lose a trade. Sometimes you make an entry expecting price to rise after bouncing off the support level. Suddenly things go horribly wrong and the price just slices through the support level. Now here you are staring at the scary possibility of your forex trading account going up in smoke.
Now the obvious temptation will be to jump back into the market to make up for your losses.- BAD IDEA. Instead, sit back, kick your shoes off, and wait for for the price to make a pullback to broken support or resistance level. And then enter after the price bounces. Let’s look at the illustration below.
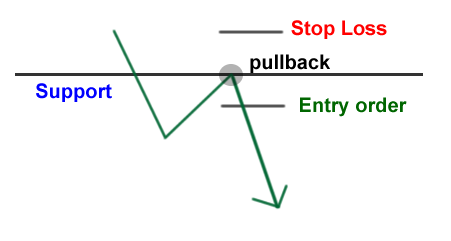
As you can see clearly, we notice a price pull back. So we can now go ahead and make our entries.
But I have to warn you though. Retests of broken supports do not happen all the time.Normally, when support and resistance levels are broken, the price will just keep on going and leave you holding the bag. that’s why it’s always advisable to put a stop order and not hope that the price will have a change of heart and give you a second chance.
Well that’s a wrap for “Identify Support and Resistance Levels with Price Action Analysis as Your Set of Binoculars” Yea I know this post is very long. But hopefully, you’d have learnt enough to apply when you enter the trades. Til next time take care.
Open Live Trading Account
If you’re looking to open a live trading account Sign Up With EasyMarkets
